Part of People.ai's value proposition has always been to use data to help sales organizations sell better.
As our machine learning improved over time, we became increasingly able to provide better and richer insights for our customers.
To make it easier for customers to slice and dice not only the data that they enter into their CRM manually but also any enriched information that we provide, we set out to create an experience that would let our users customize how we calculate their data.
There's a four-year history to this project, but feel free to skip ahead to the actual Insights Builder project.
People.ai's system had always given users the ability to filter their data based on standard and custom CRM fields.
This filtering was always limited to activity data against Users, Opportunities, Accounts, and Campaigns.
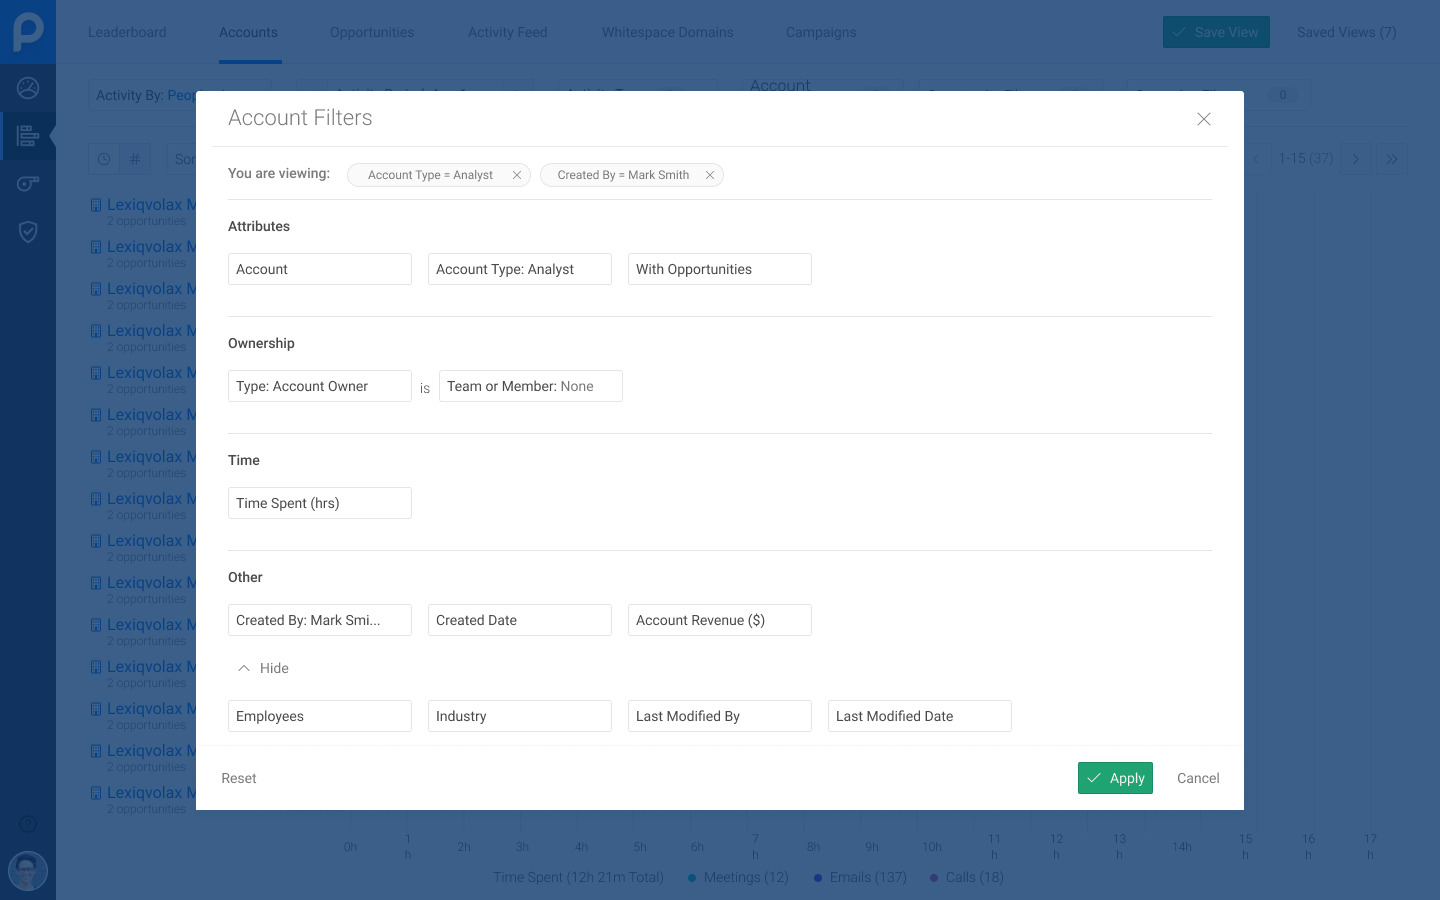
The Analytics module gave users the ability to set filters against activity data and create saved views, but the filters were designed to be absolute, meaning users would have to create multiple copies of the same set of filters for different teams.
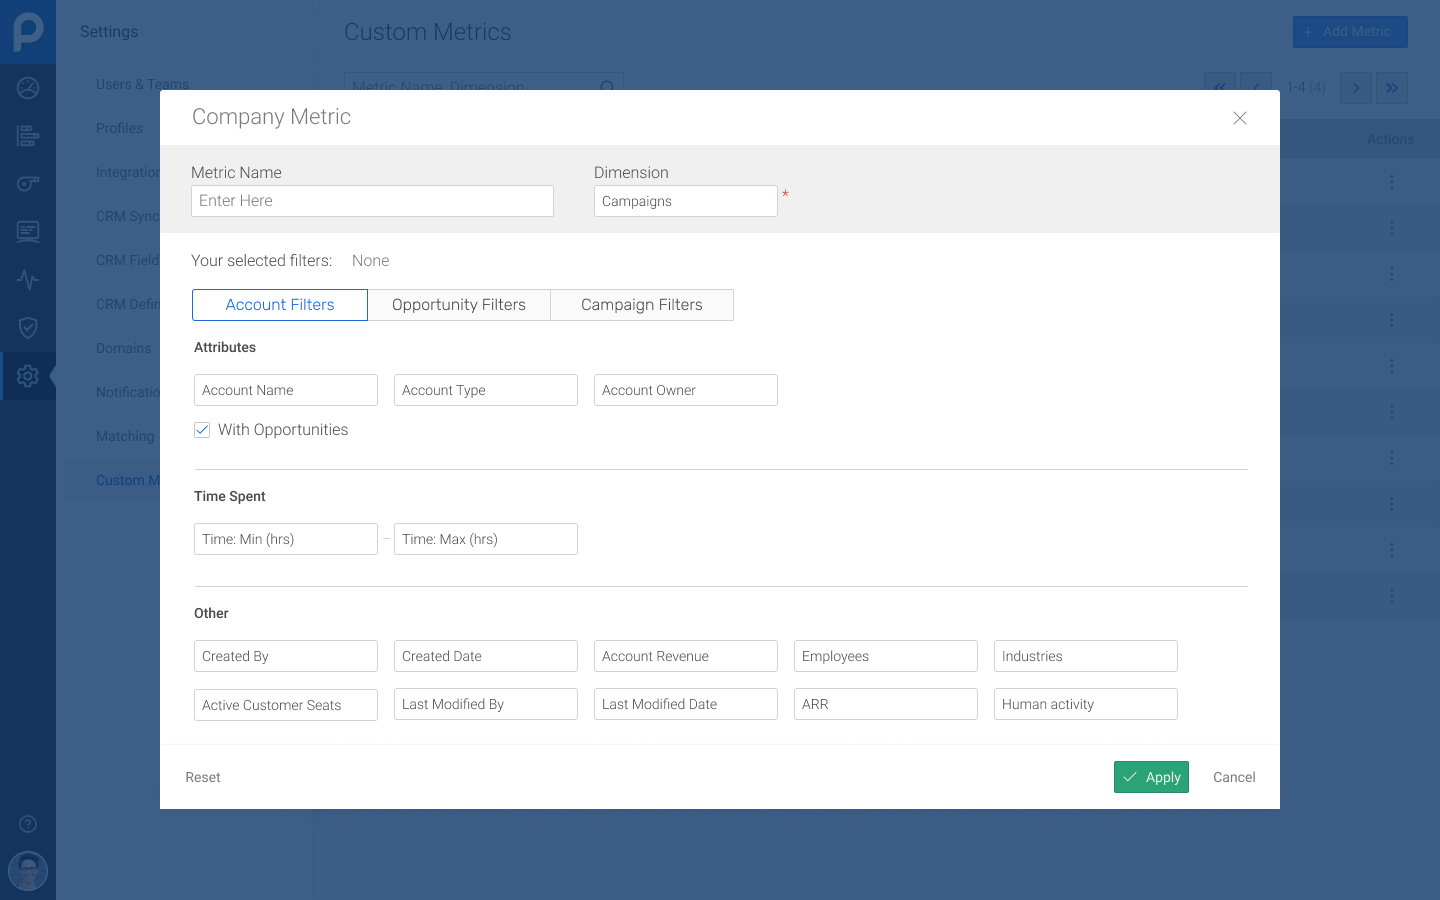
In early 2019, our design team worked on a concept for a next-generation Analytics module called Workspaces, replacing the filters with Custom Metrics that were relative instead of absolute, providing more flexibility while reducing overhead.
In late 2019, we began to strategize about the future of our product:
- We now had richer data that a customer could leverage to empower and coach their teams more effectively.
- We also wanted our product to fit into a user's existing workflow to reduce the chances of tool fatigue impacting adoption.
We organized ourselves into three lanes to focus on deal health, performance metrics, and data customization.
Assigned to the Data Customization lane, a product manager and I worked on began to work on concepts and ideas.
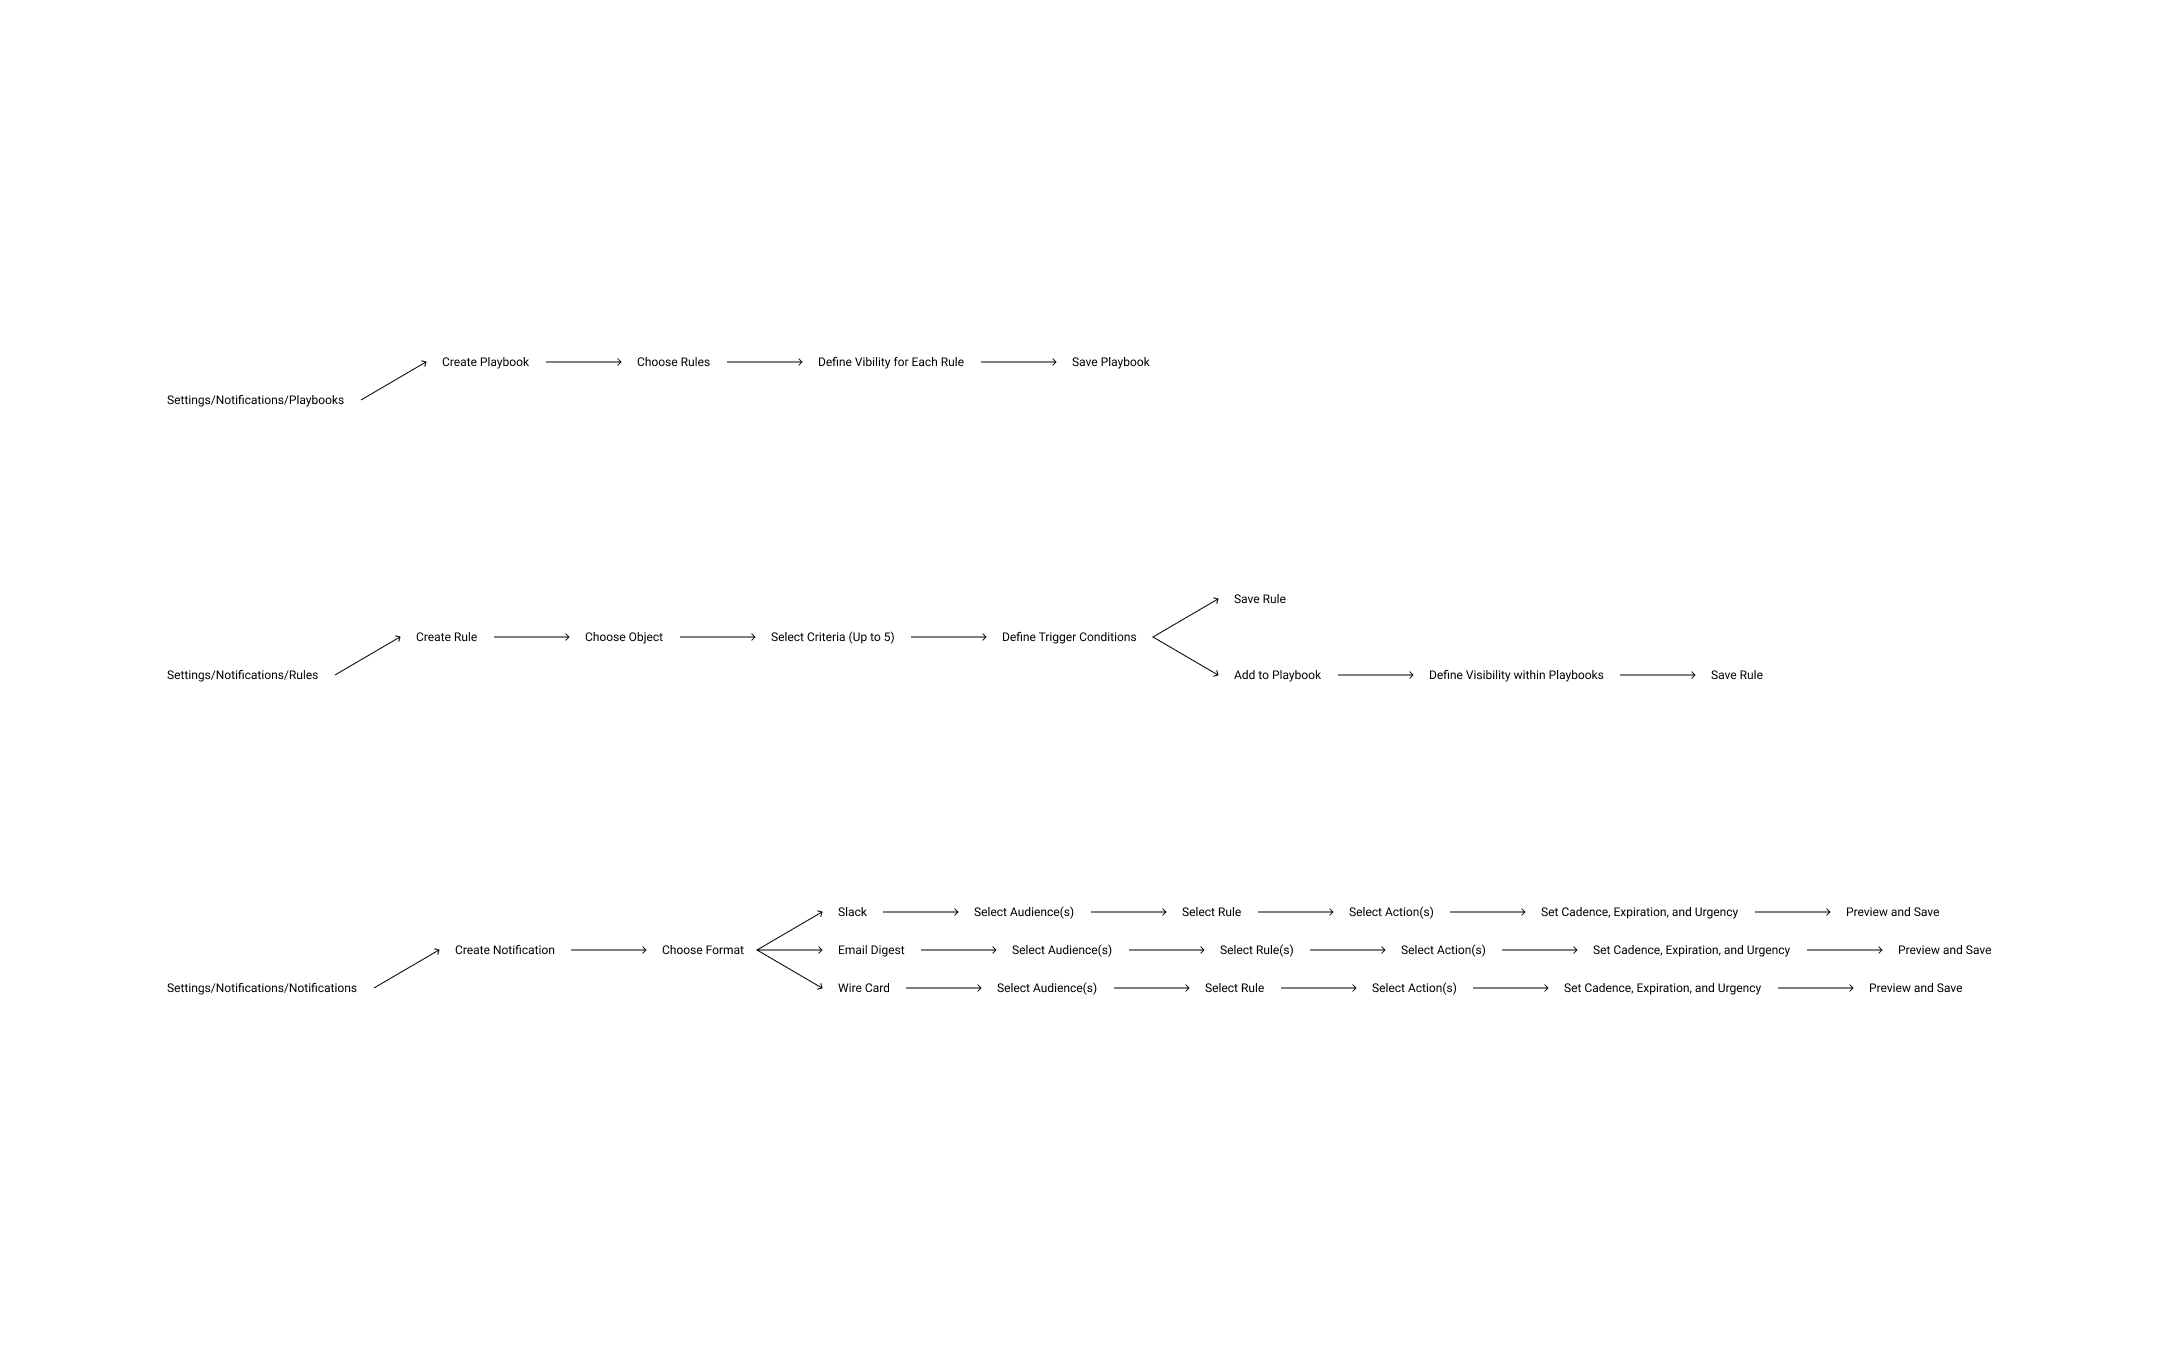
I started out mapping out the concept and the flow: we wanted users to be able to create a library of rules that could be used to trigger notifications and that could be added to "playbooks".
For the experience itself, we used our internal prior work as a starting point and looked at several external tools for reference, especially around the notifications builder.
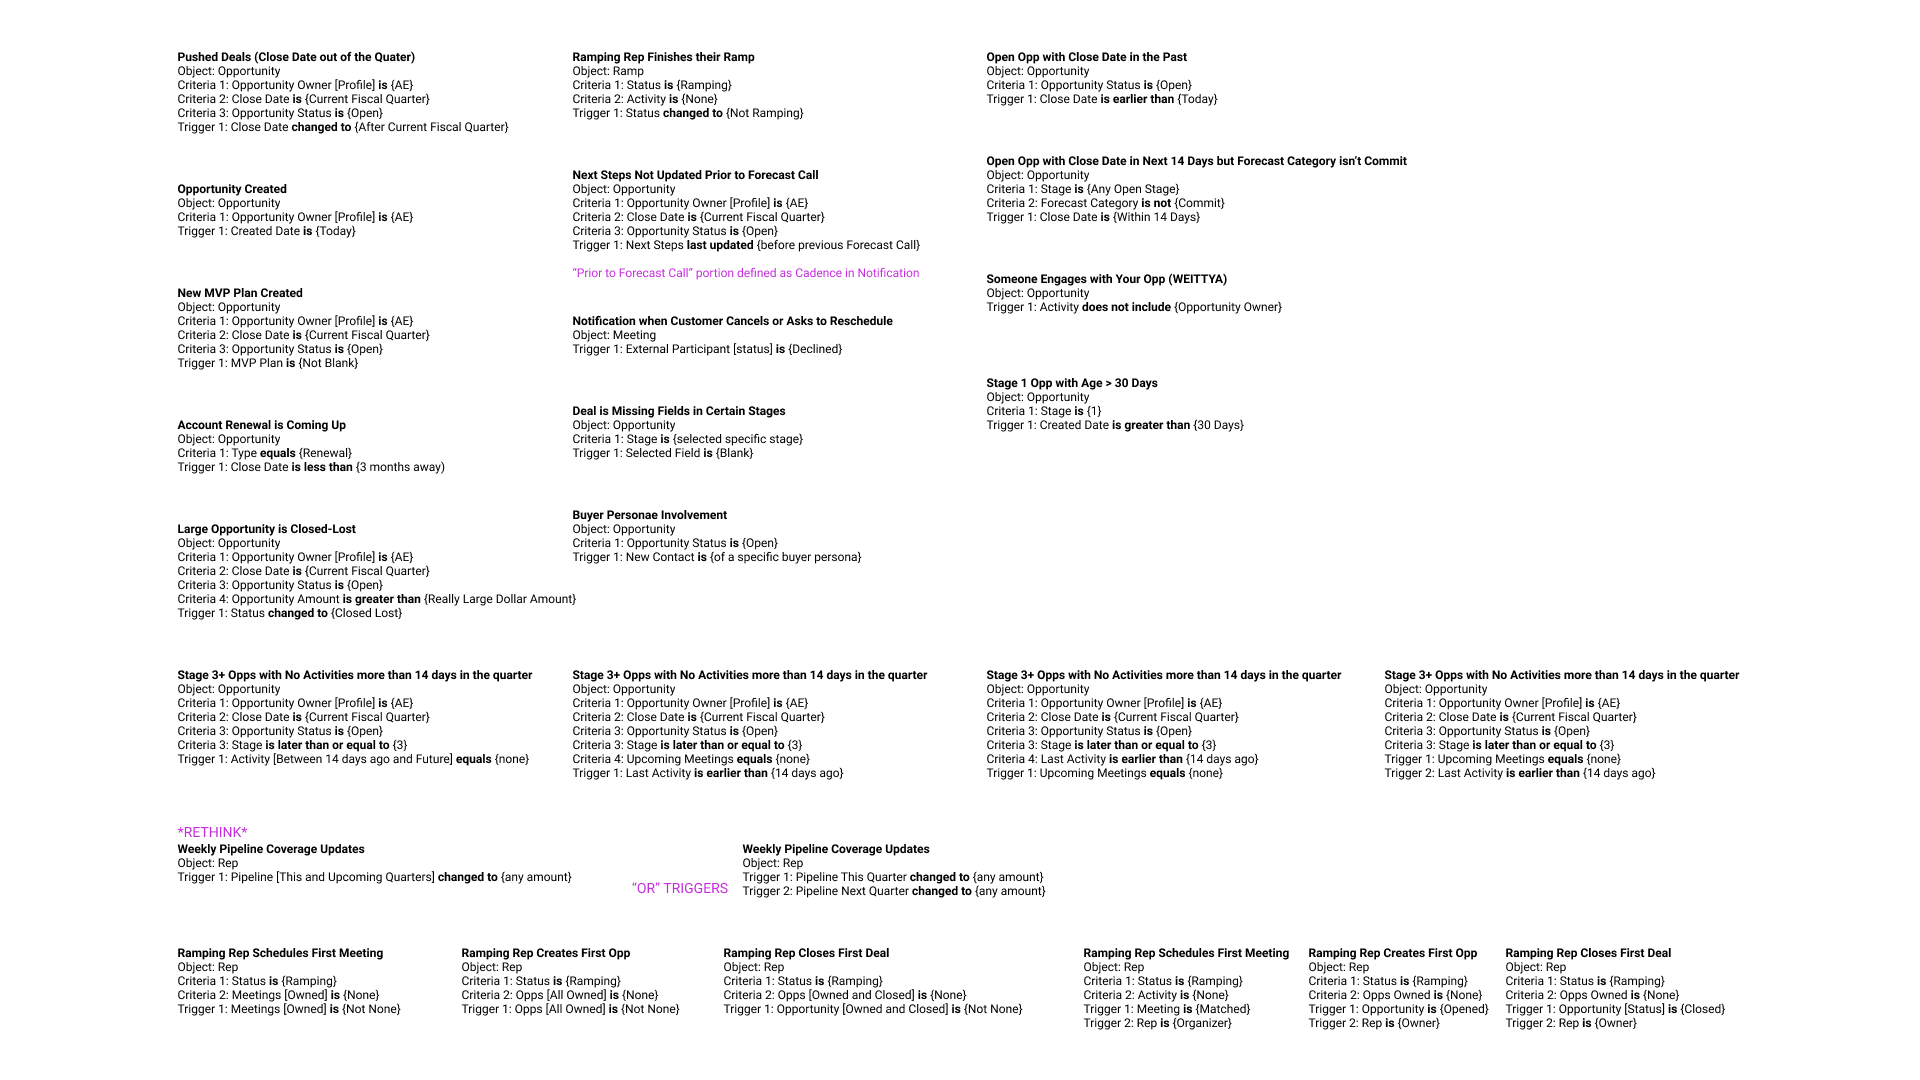
For the rules part of the project, our product manager, sales operations manager, and I worked together to determine what sets of criteria our customers would commonly want to create and what sort of logic we would need to accommodate.
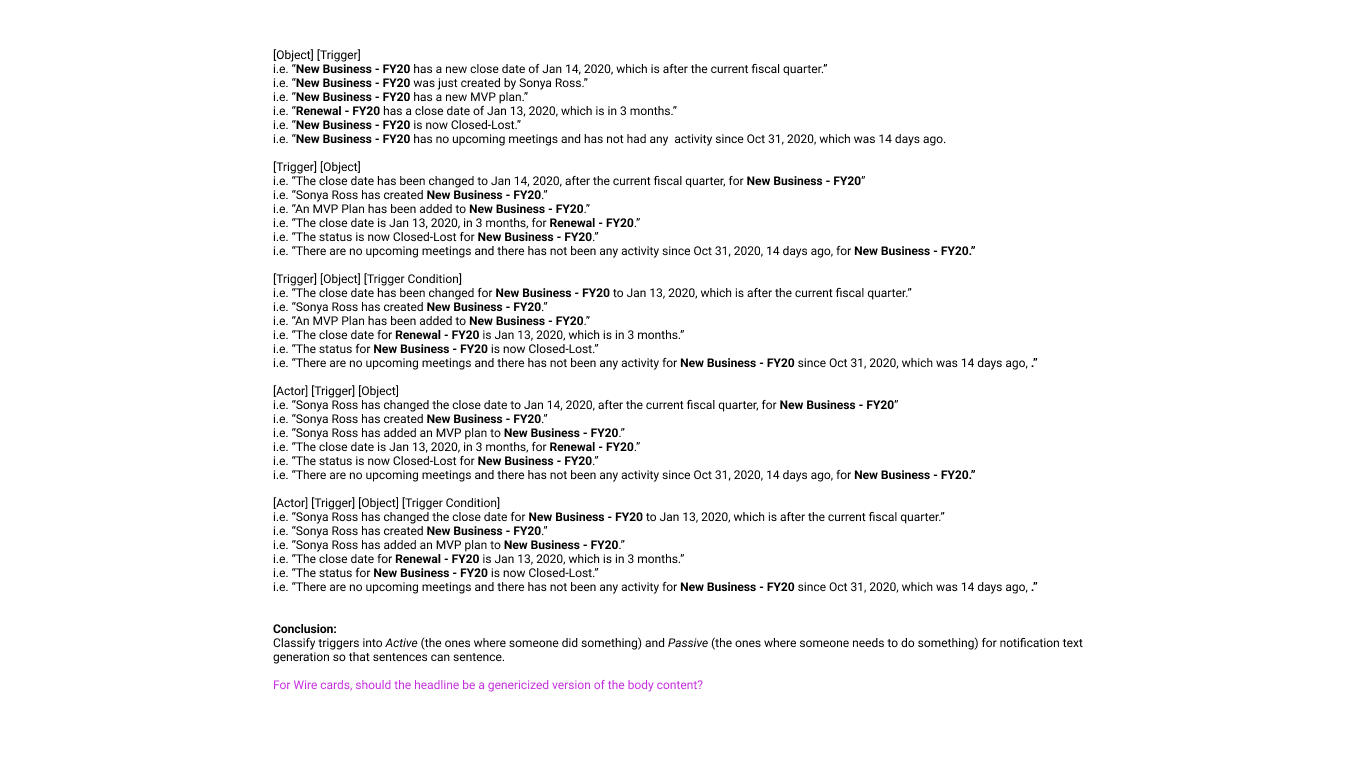
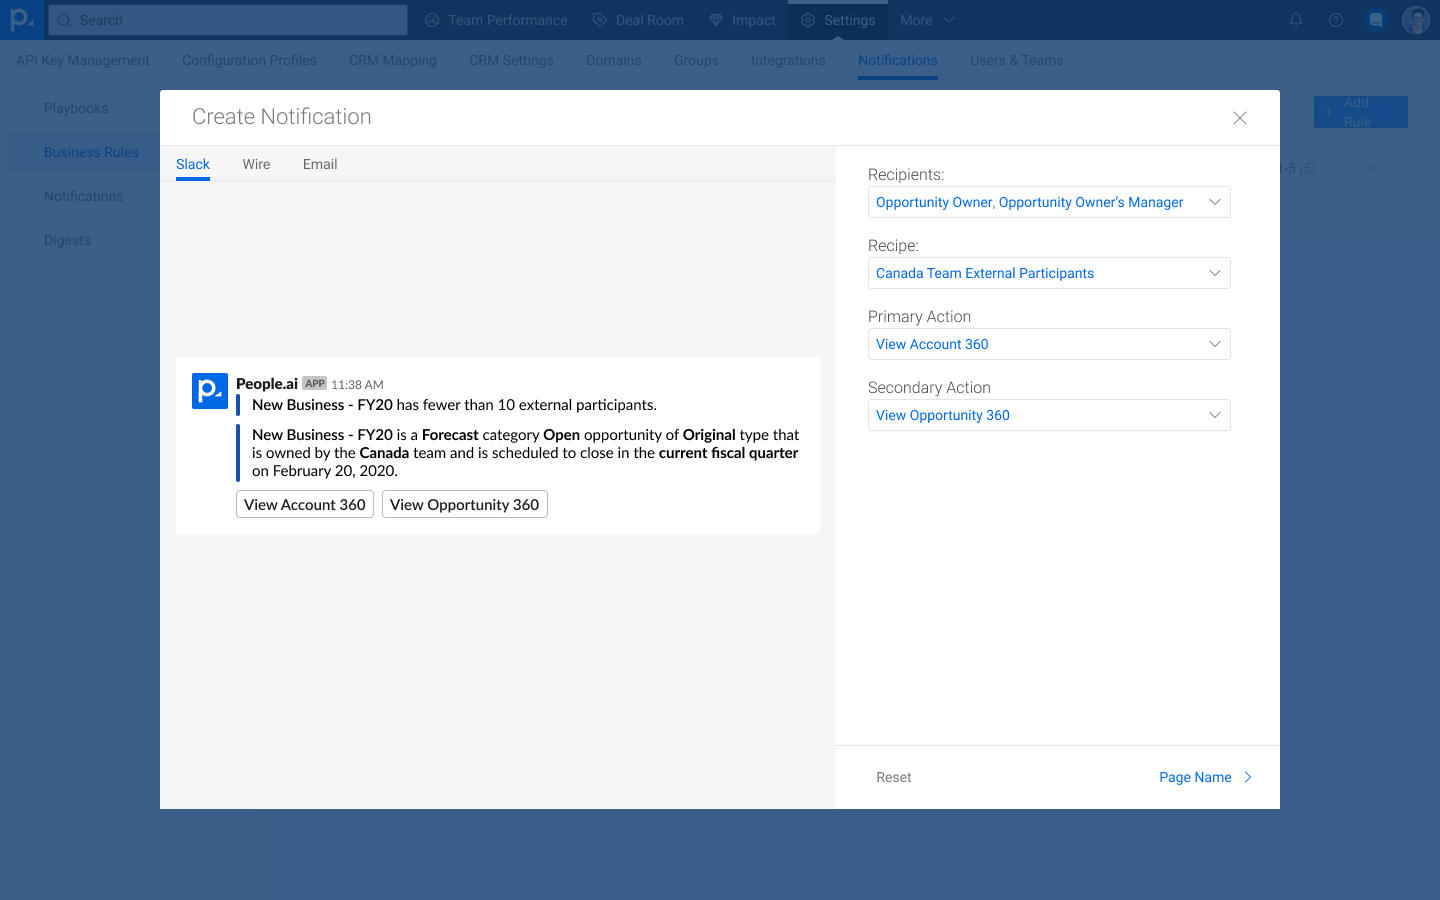
For the notifications part of the project, I worked with Engineering and took various examples from our rules logic exercise to work out how we could consistently and reliably Mad Libs a sentence with minimal user input.
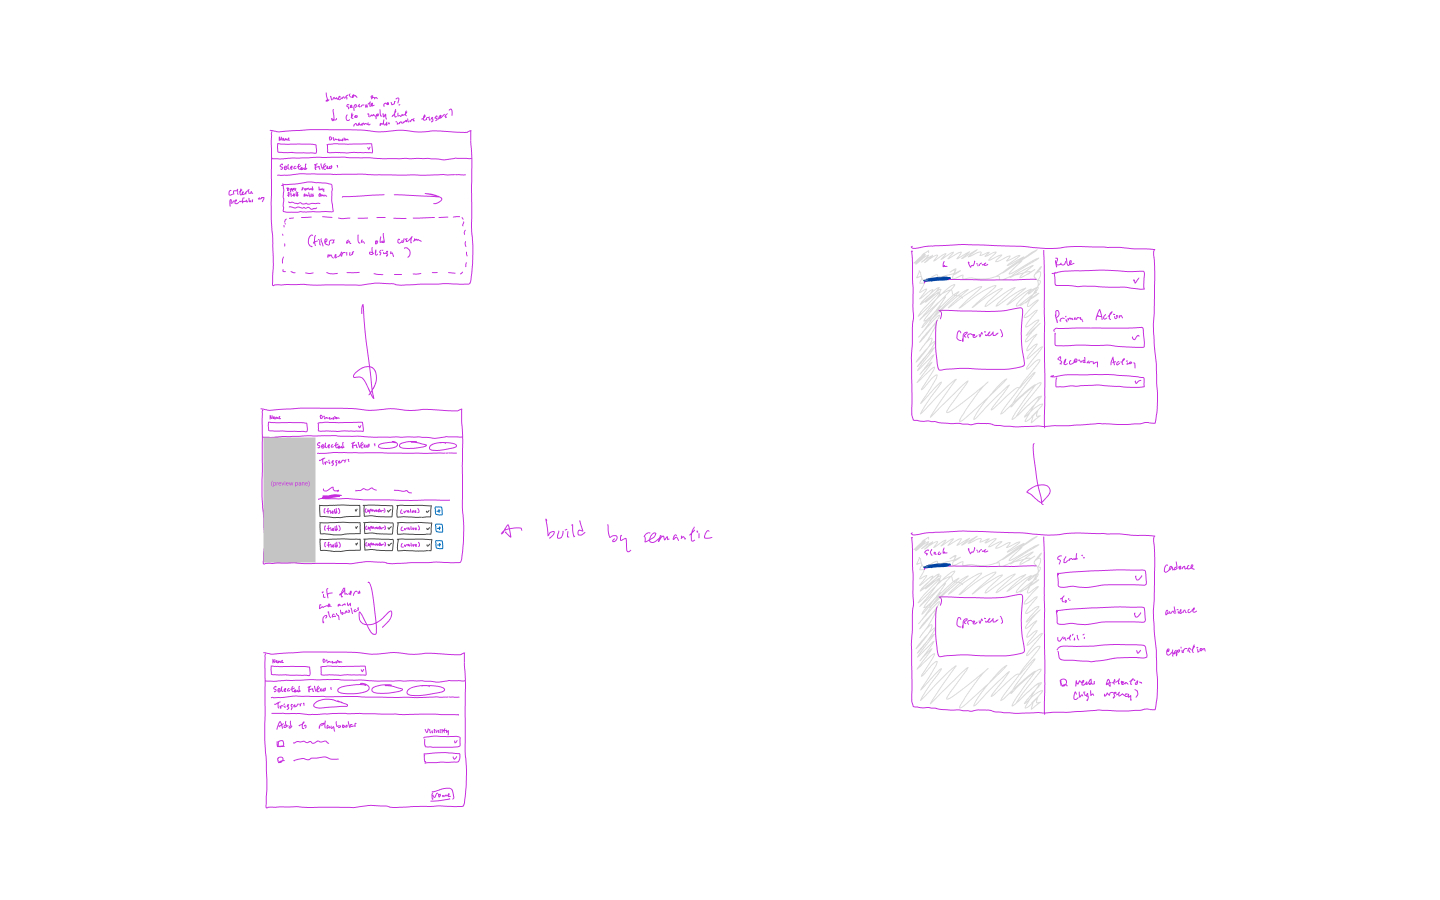
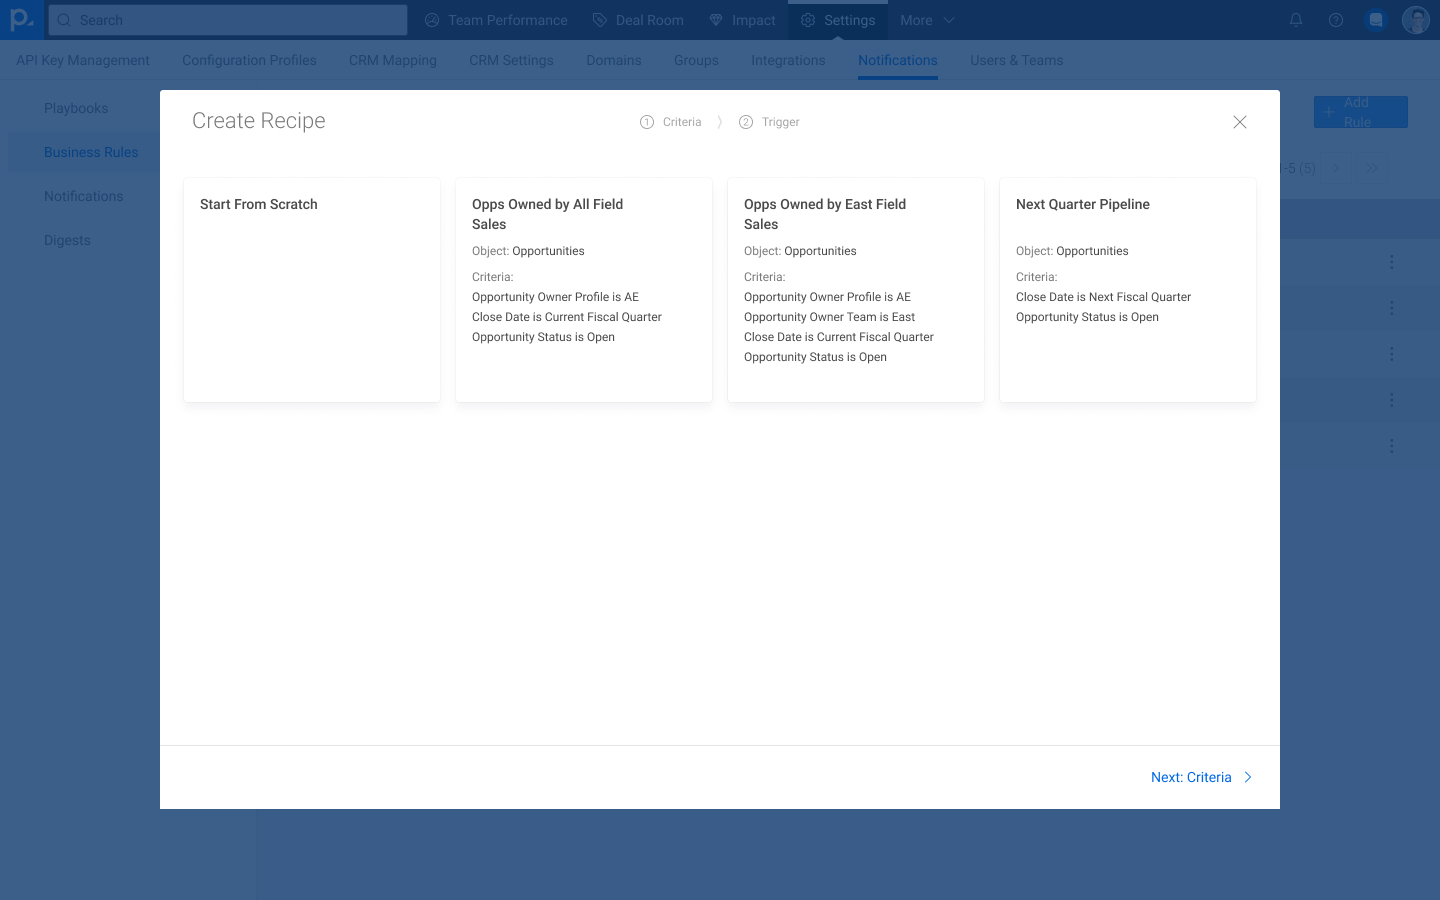
For this iteration, we created a workflow where users start either from scratch or with "recipes" (aka templates), set their criteria, define a trigger, and optionally customize a notification.
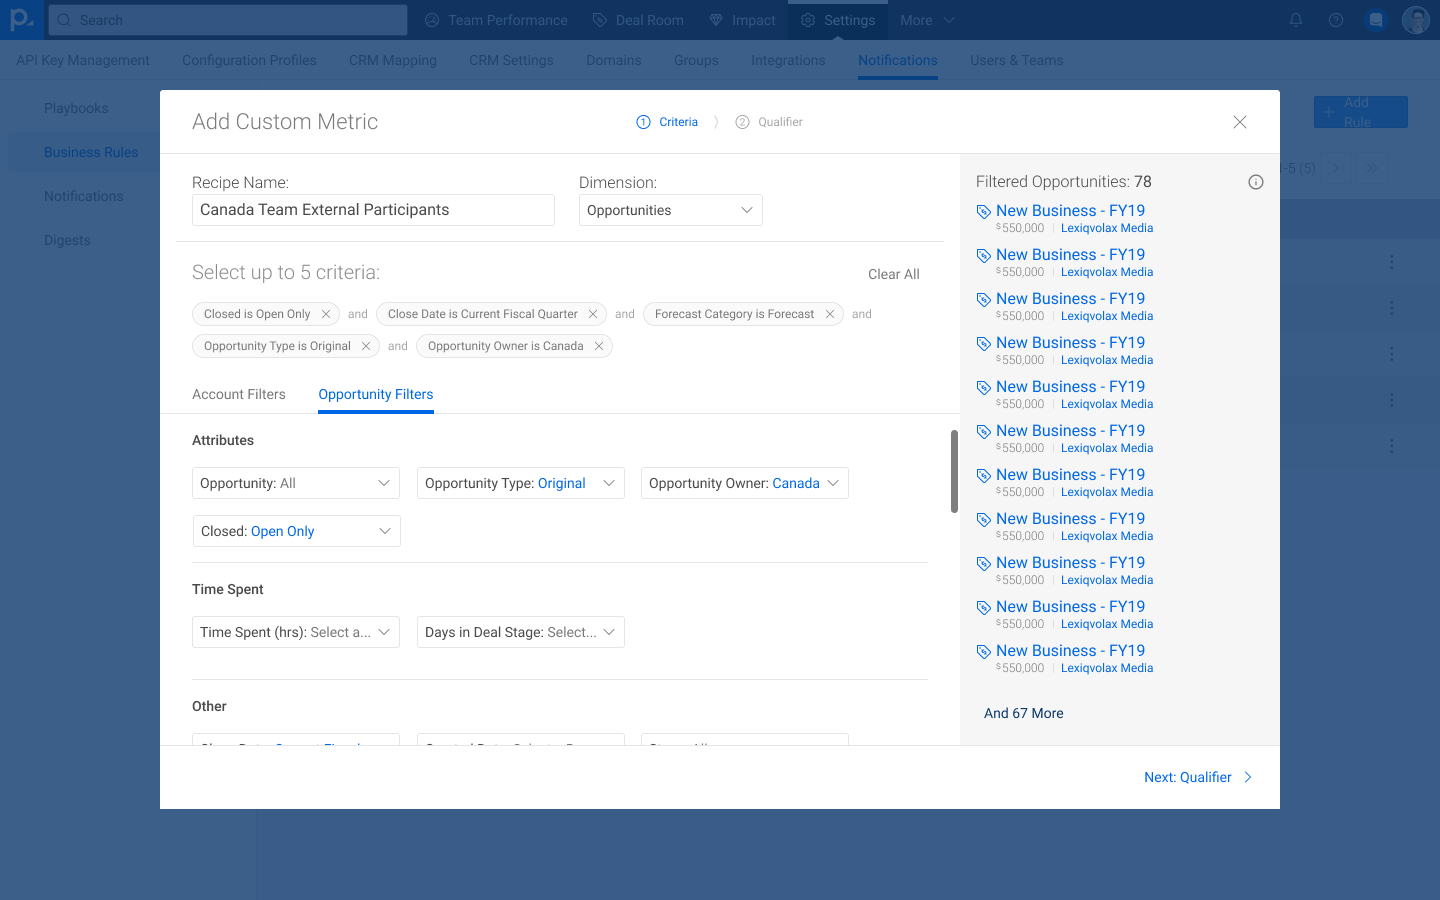
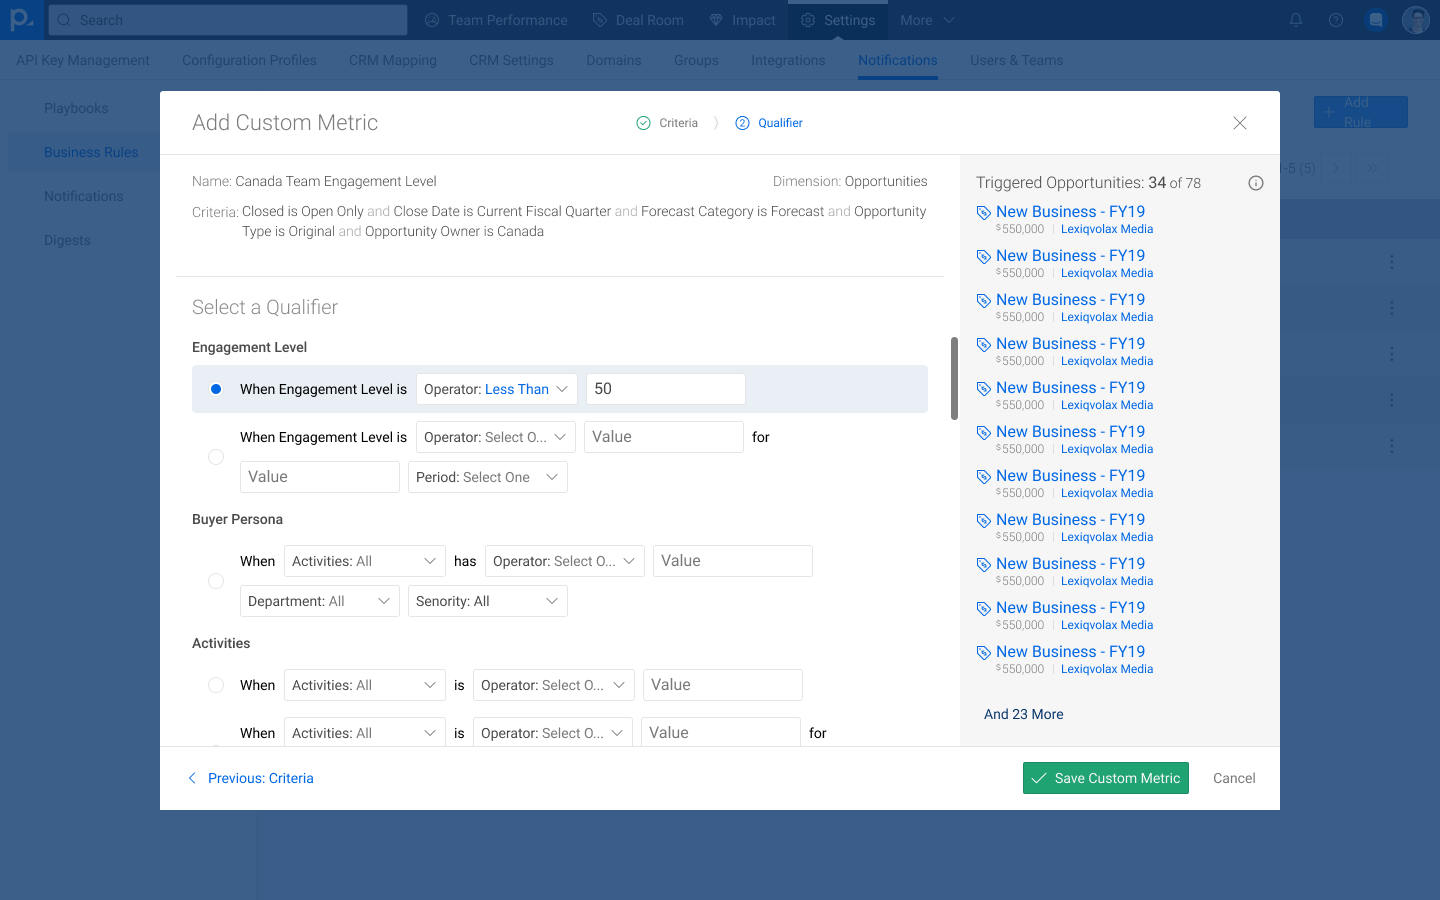
For setting the rule's criteria, we focused on improving upon our existing filtering experience by making the logic more explicit and by providing a preview of what this set of filters would return across the customer's CRM.
Unfortunately, due to resources and prioritization, the Data Customization project was put on the backburner and this iteration was never released.
Once the rest of the Sales Solution had shipped, it became extremely apparent that we had a scalability issue: when customers wanted to build set of leading indicators, our engineering team had to do the configuration, which began to impact the development of new features.
Another product manager and I teamed up to create what we dubbed the Indicator Configurator.
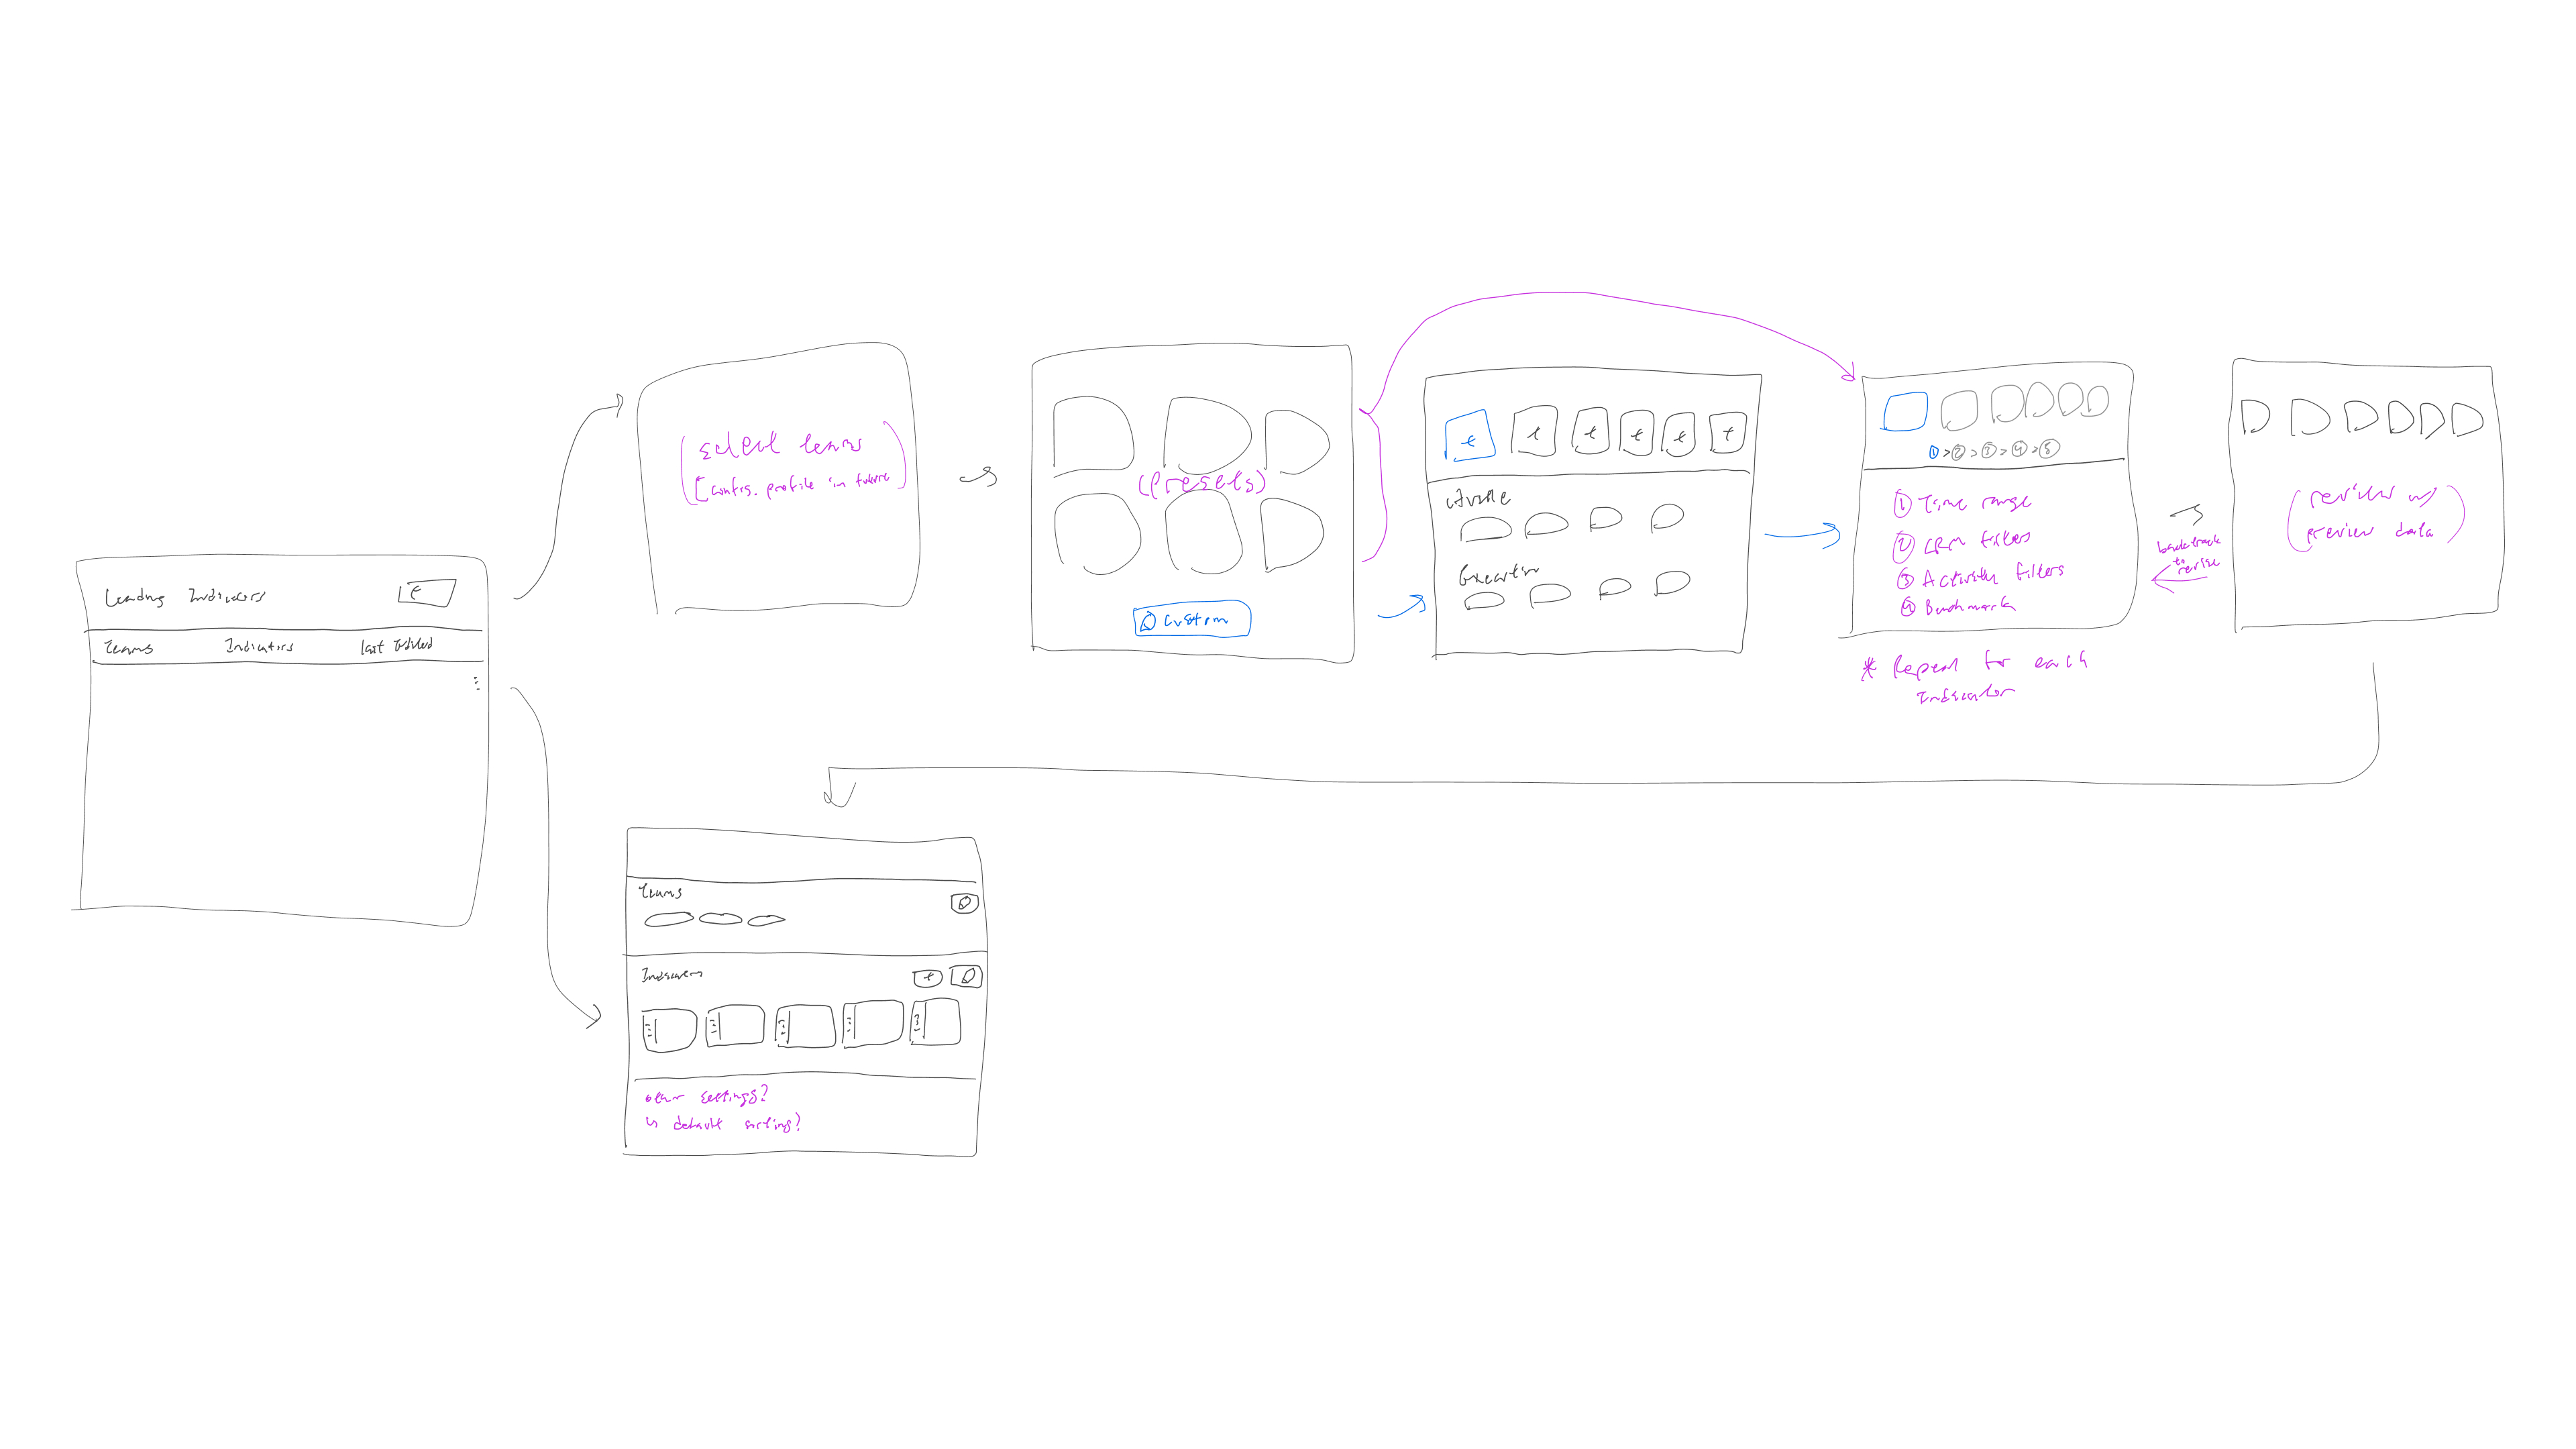
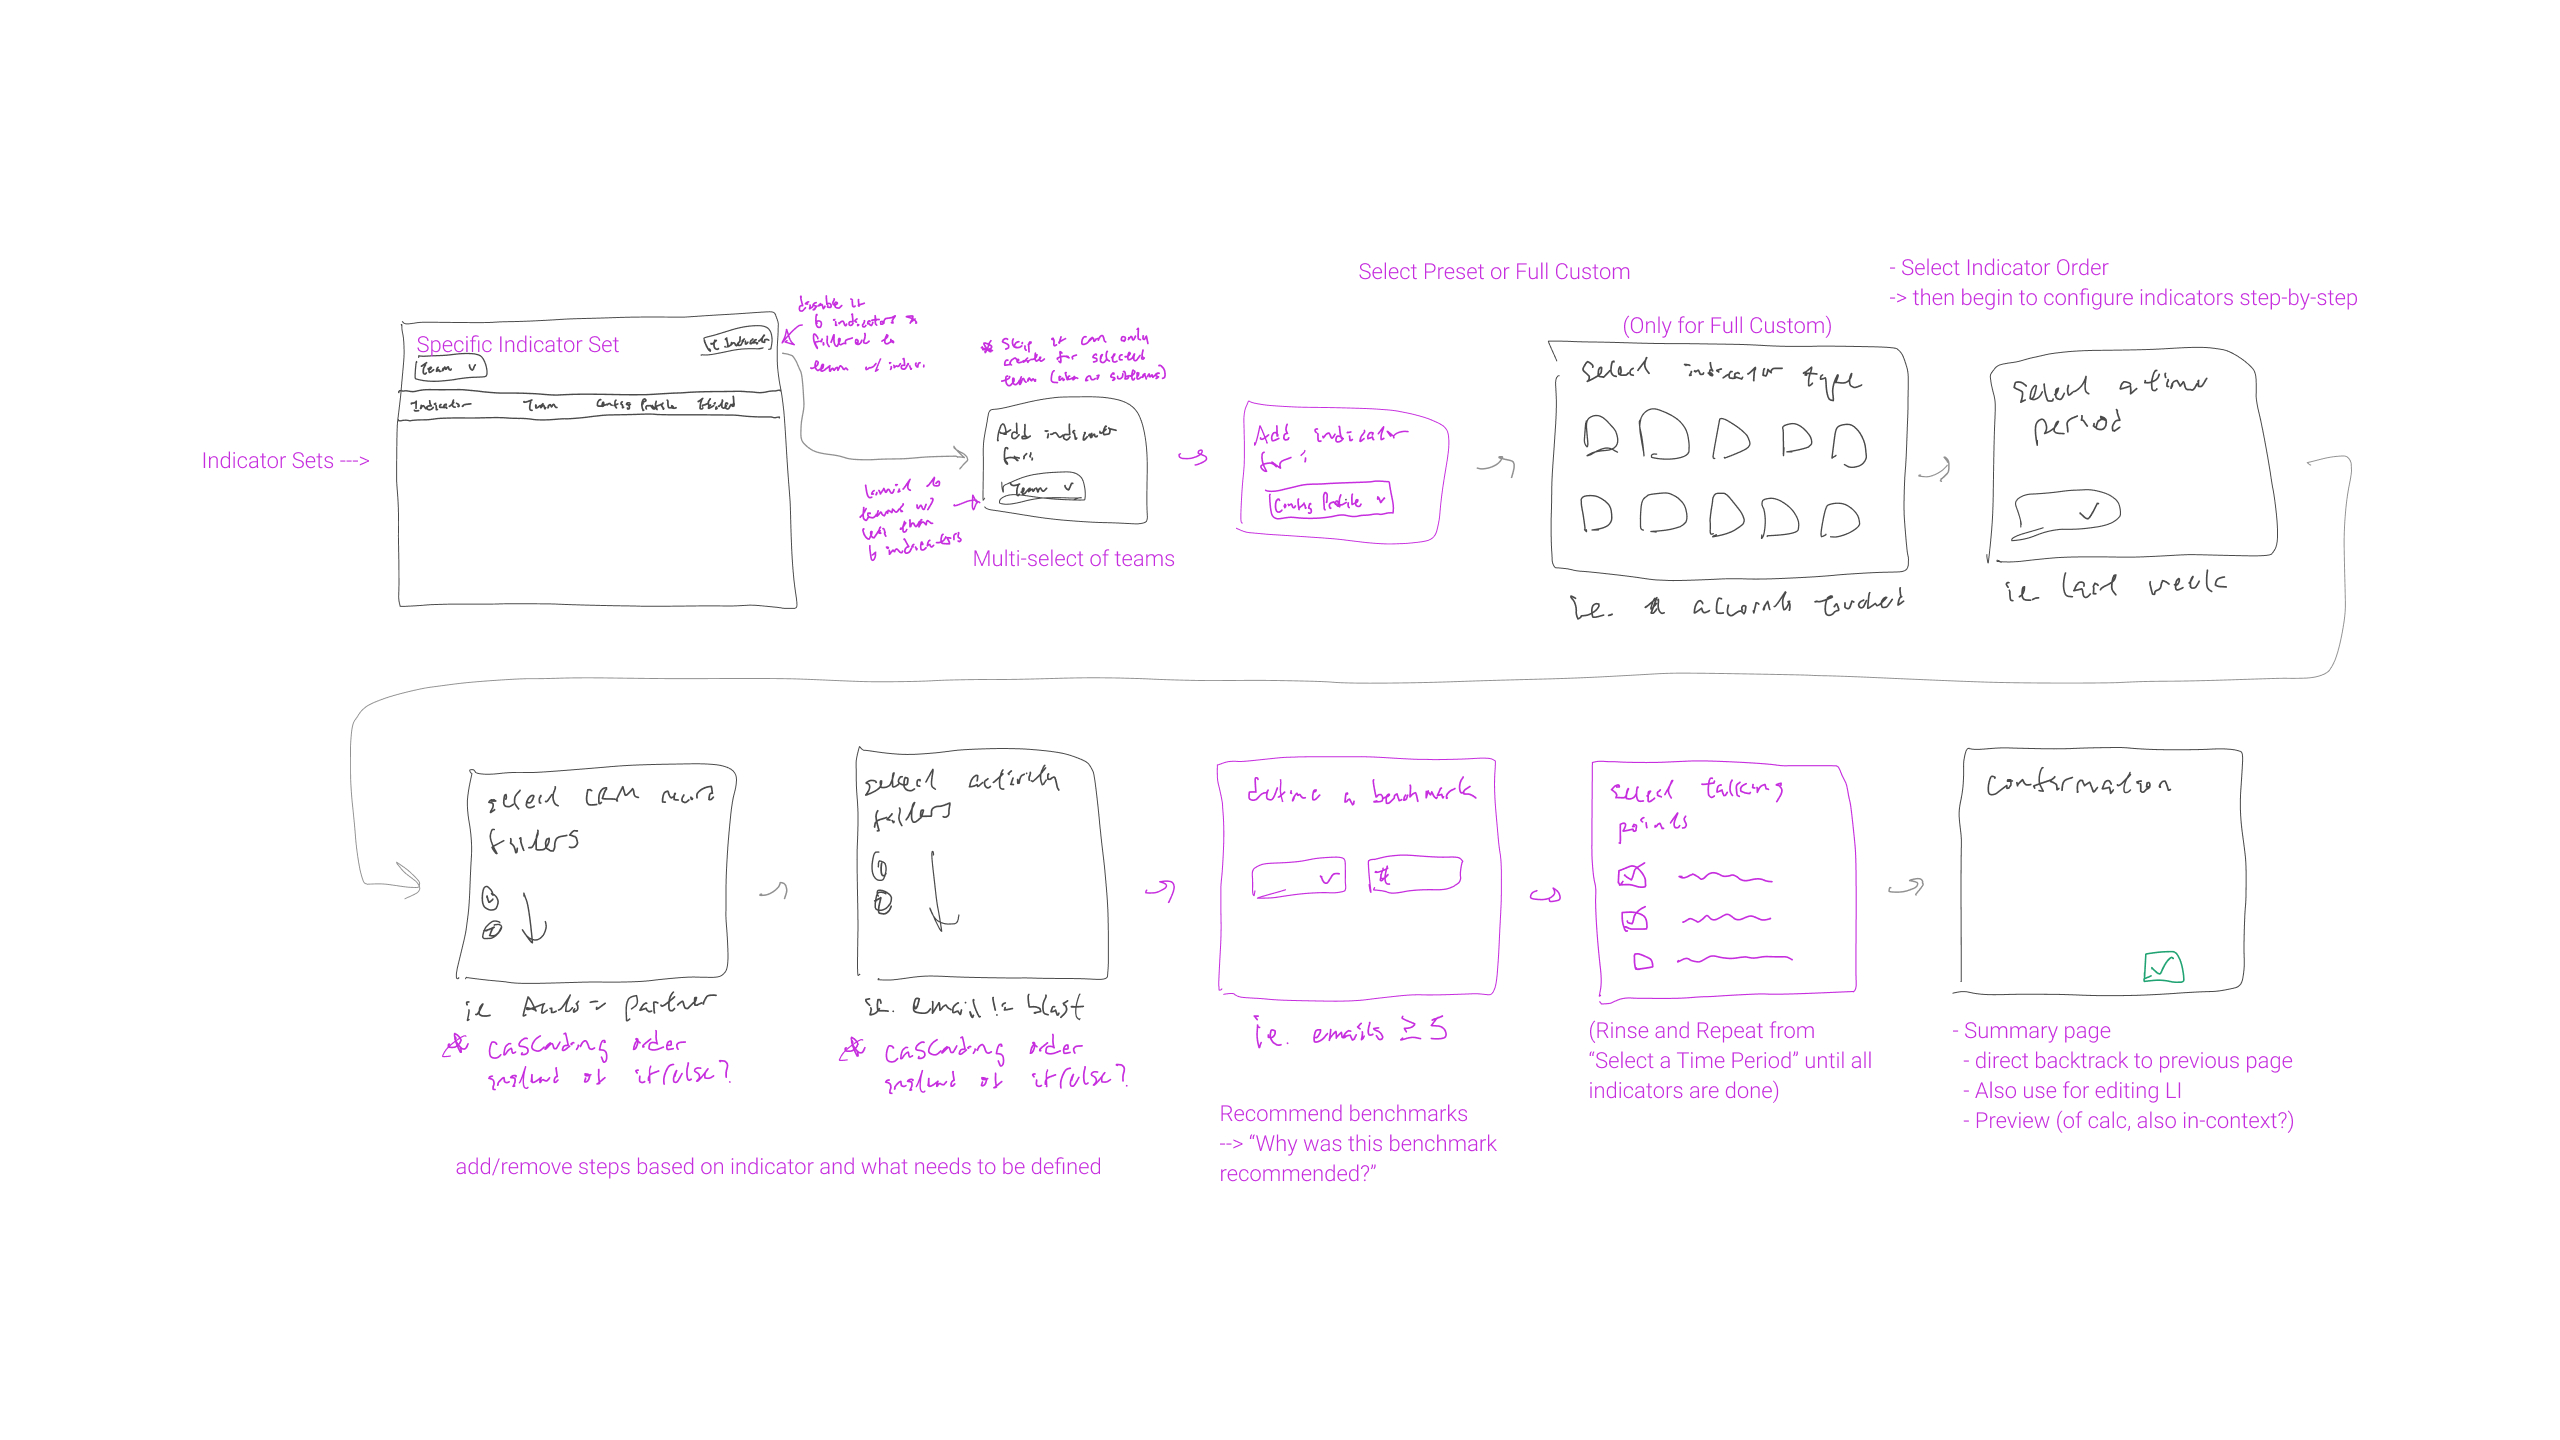
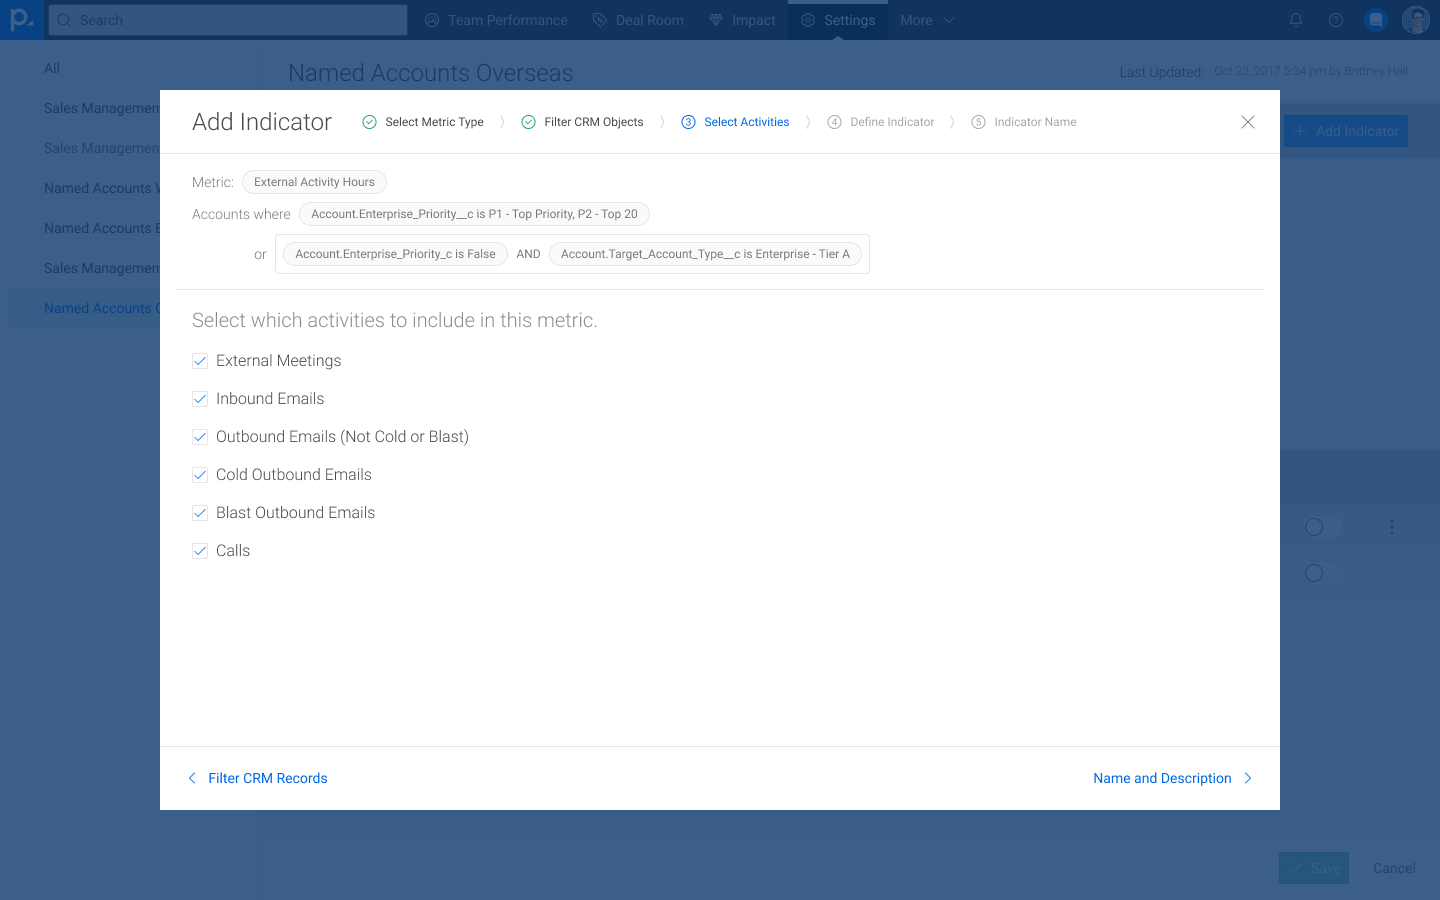
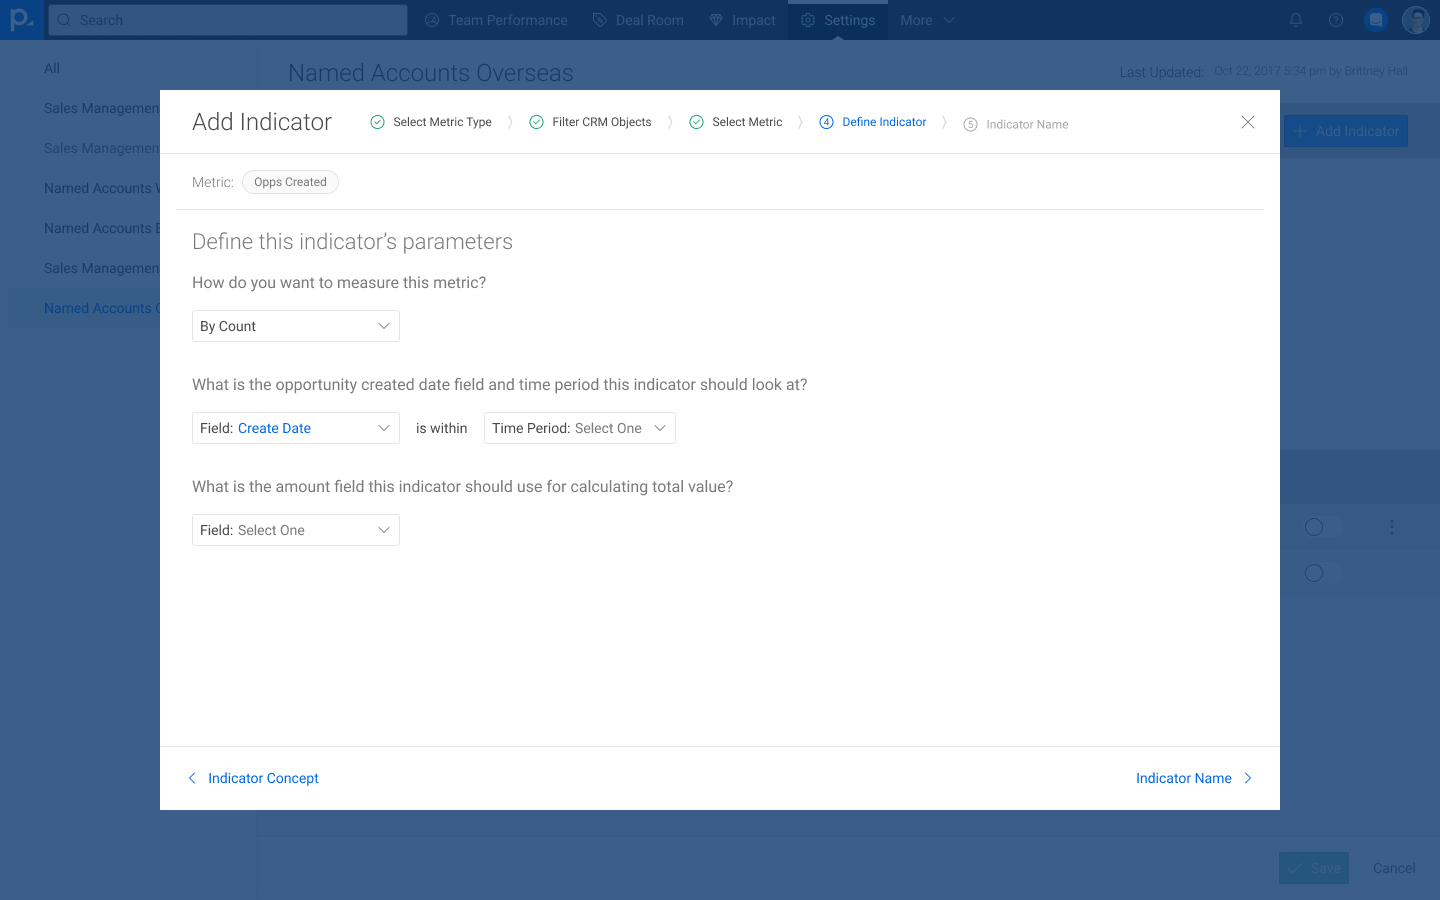
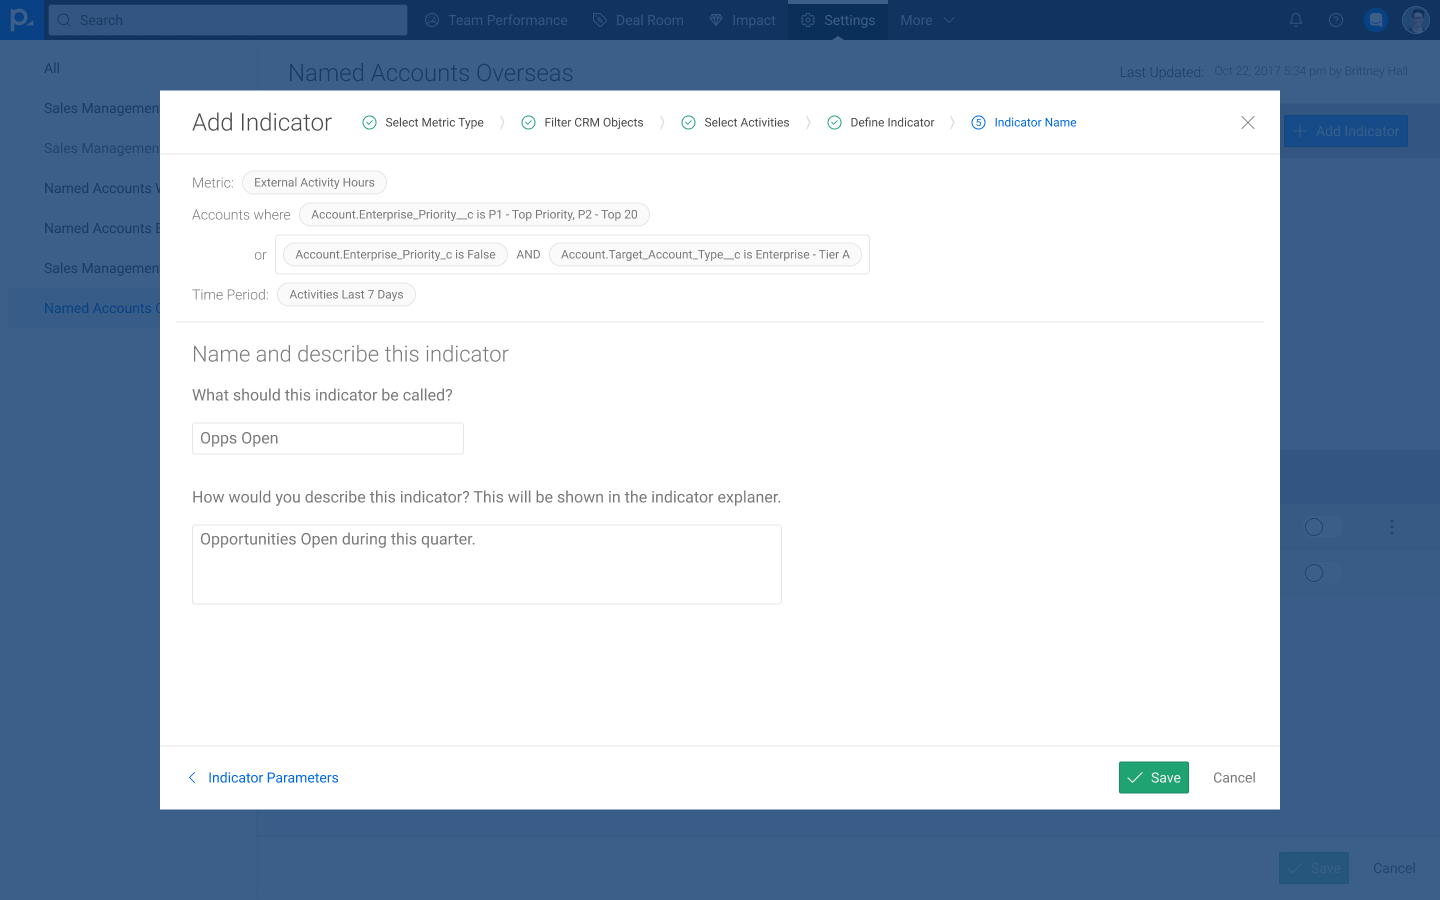
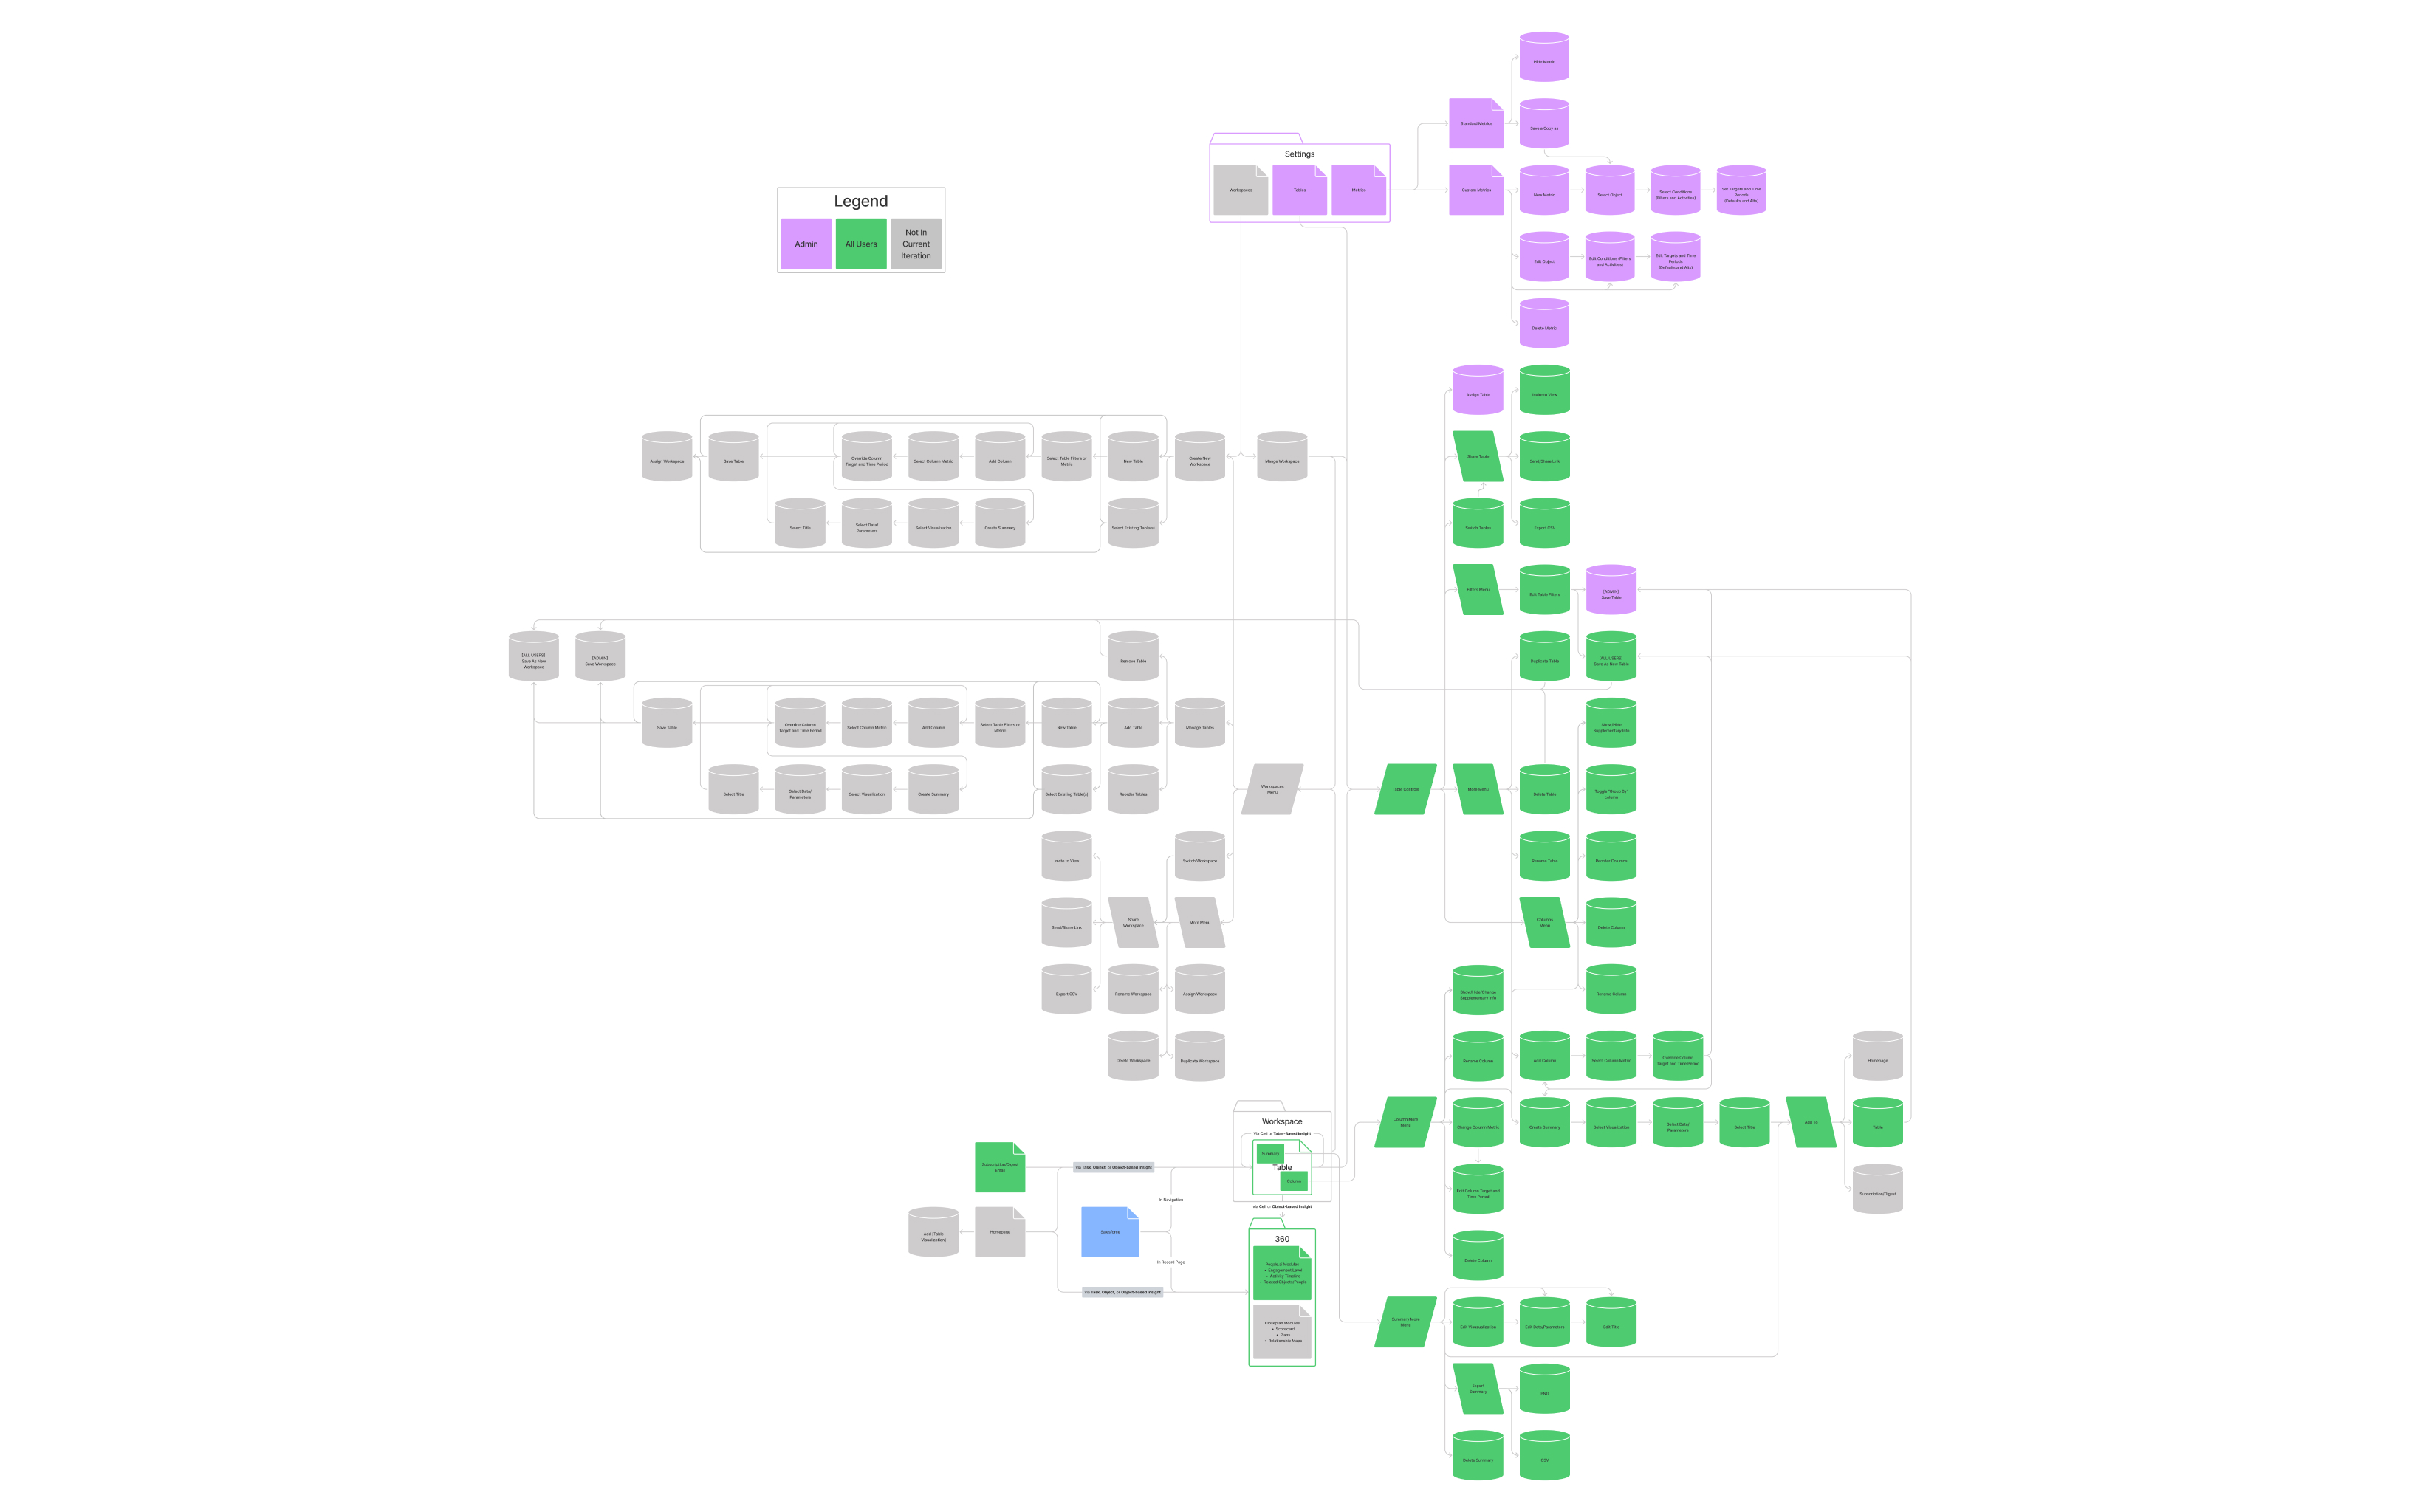
I started out sketching out an overall flow for the Indicator Configurator based on a worksheet that our engineering team had created for our Customer Success team to facilitate the creation of leading indicators.
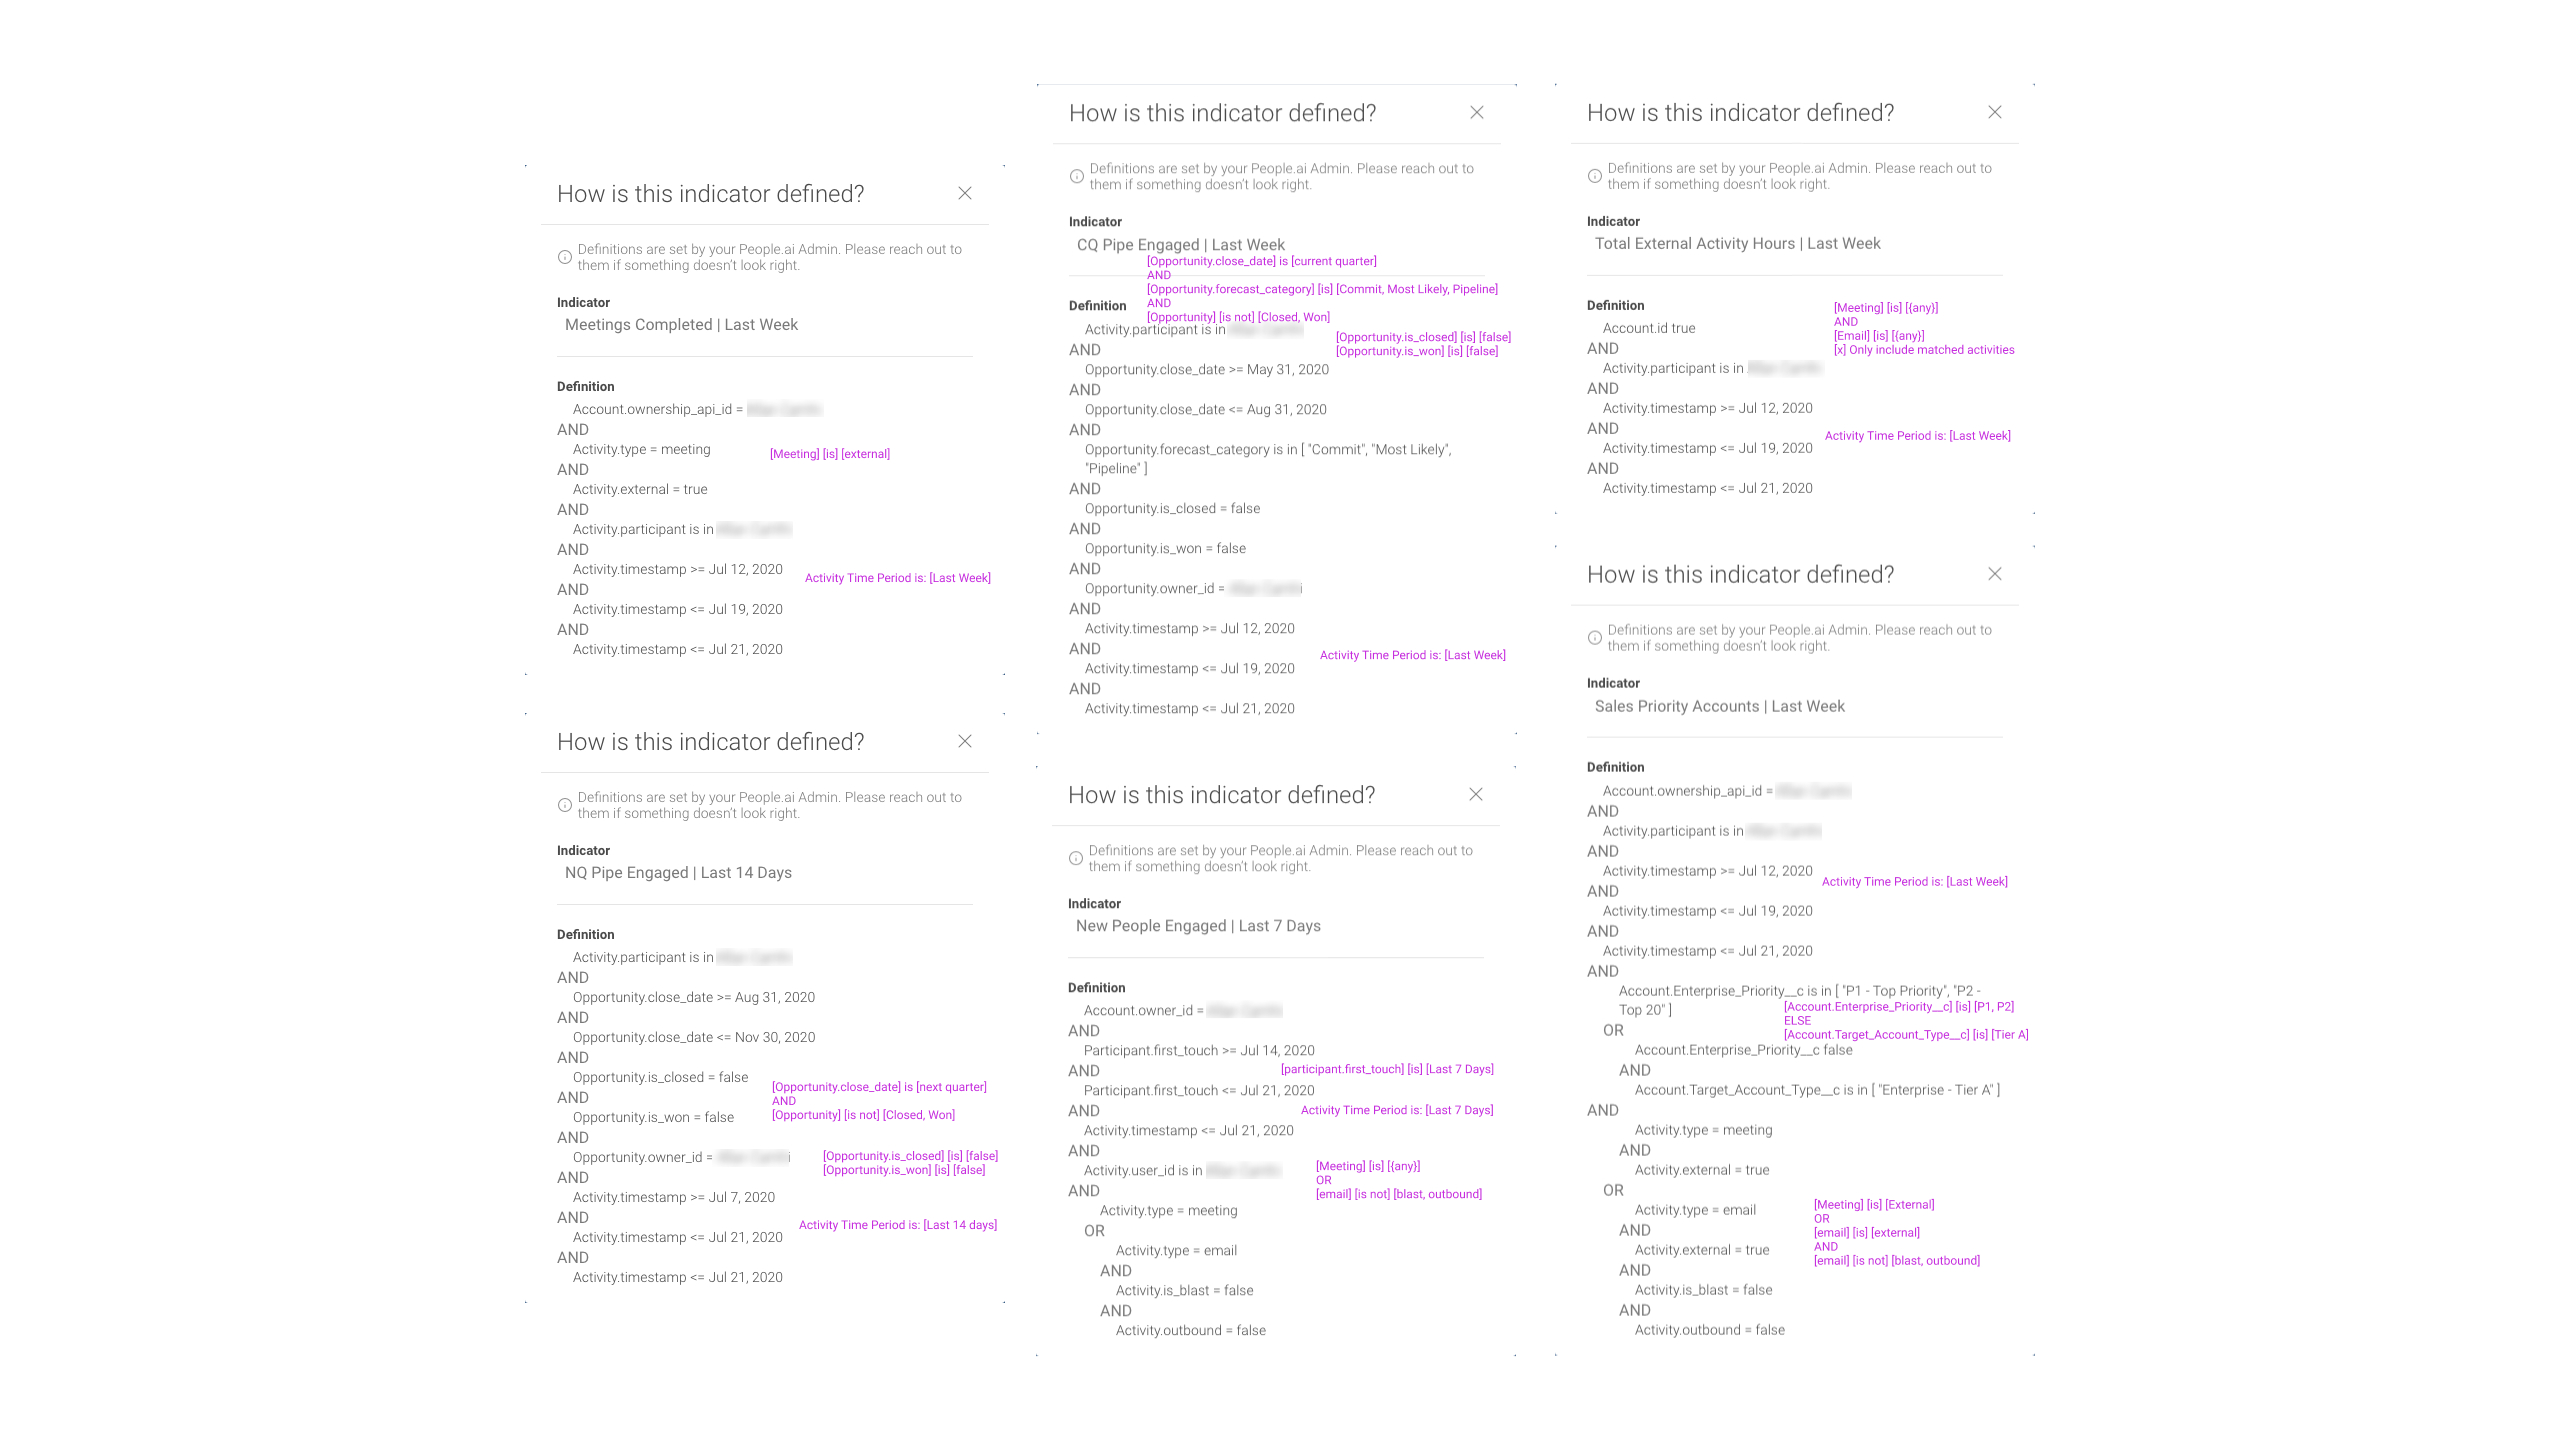
The engineering team already had an implemented method for filtering in place; rather than continuing to use what we had designed previously, I started by breaking down our engineers' implementation into something repeatable.
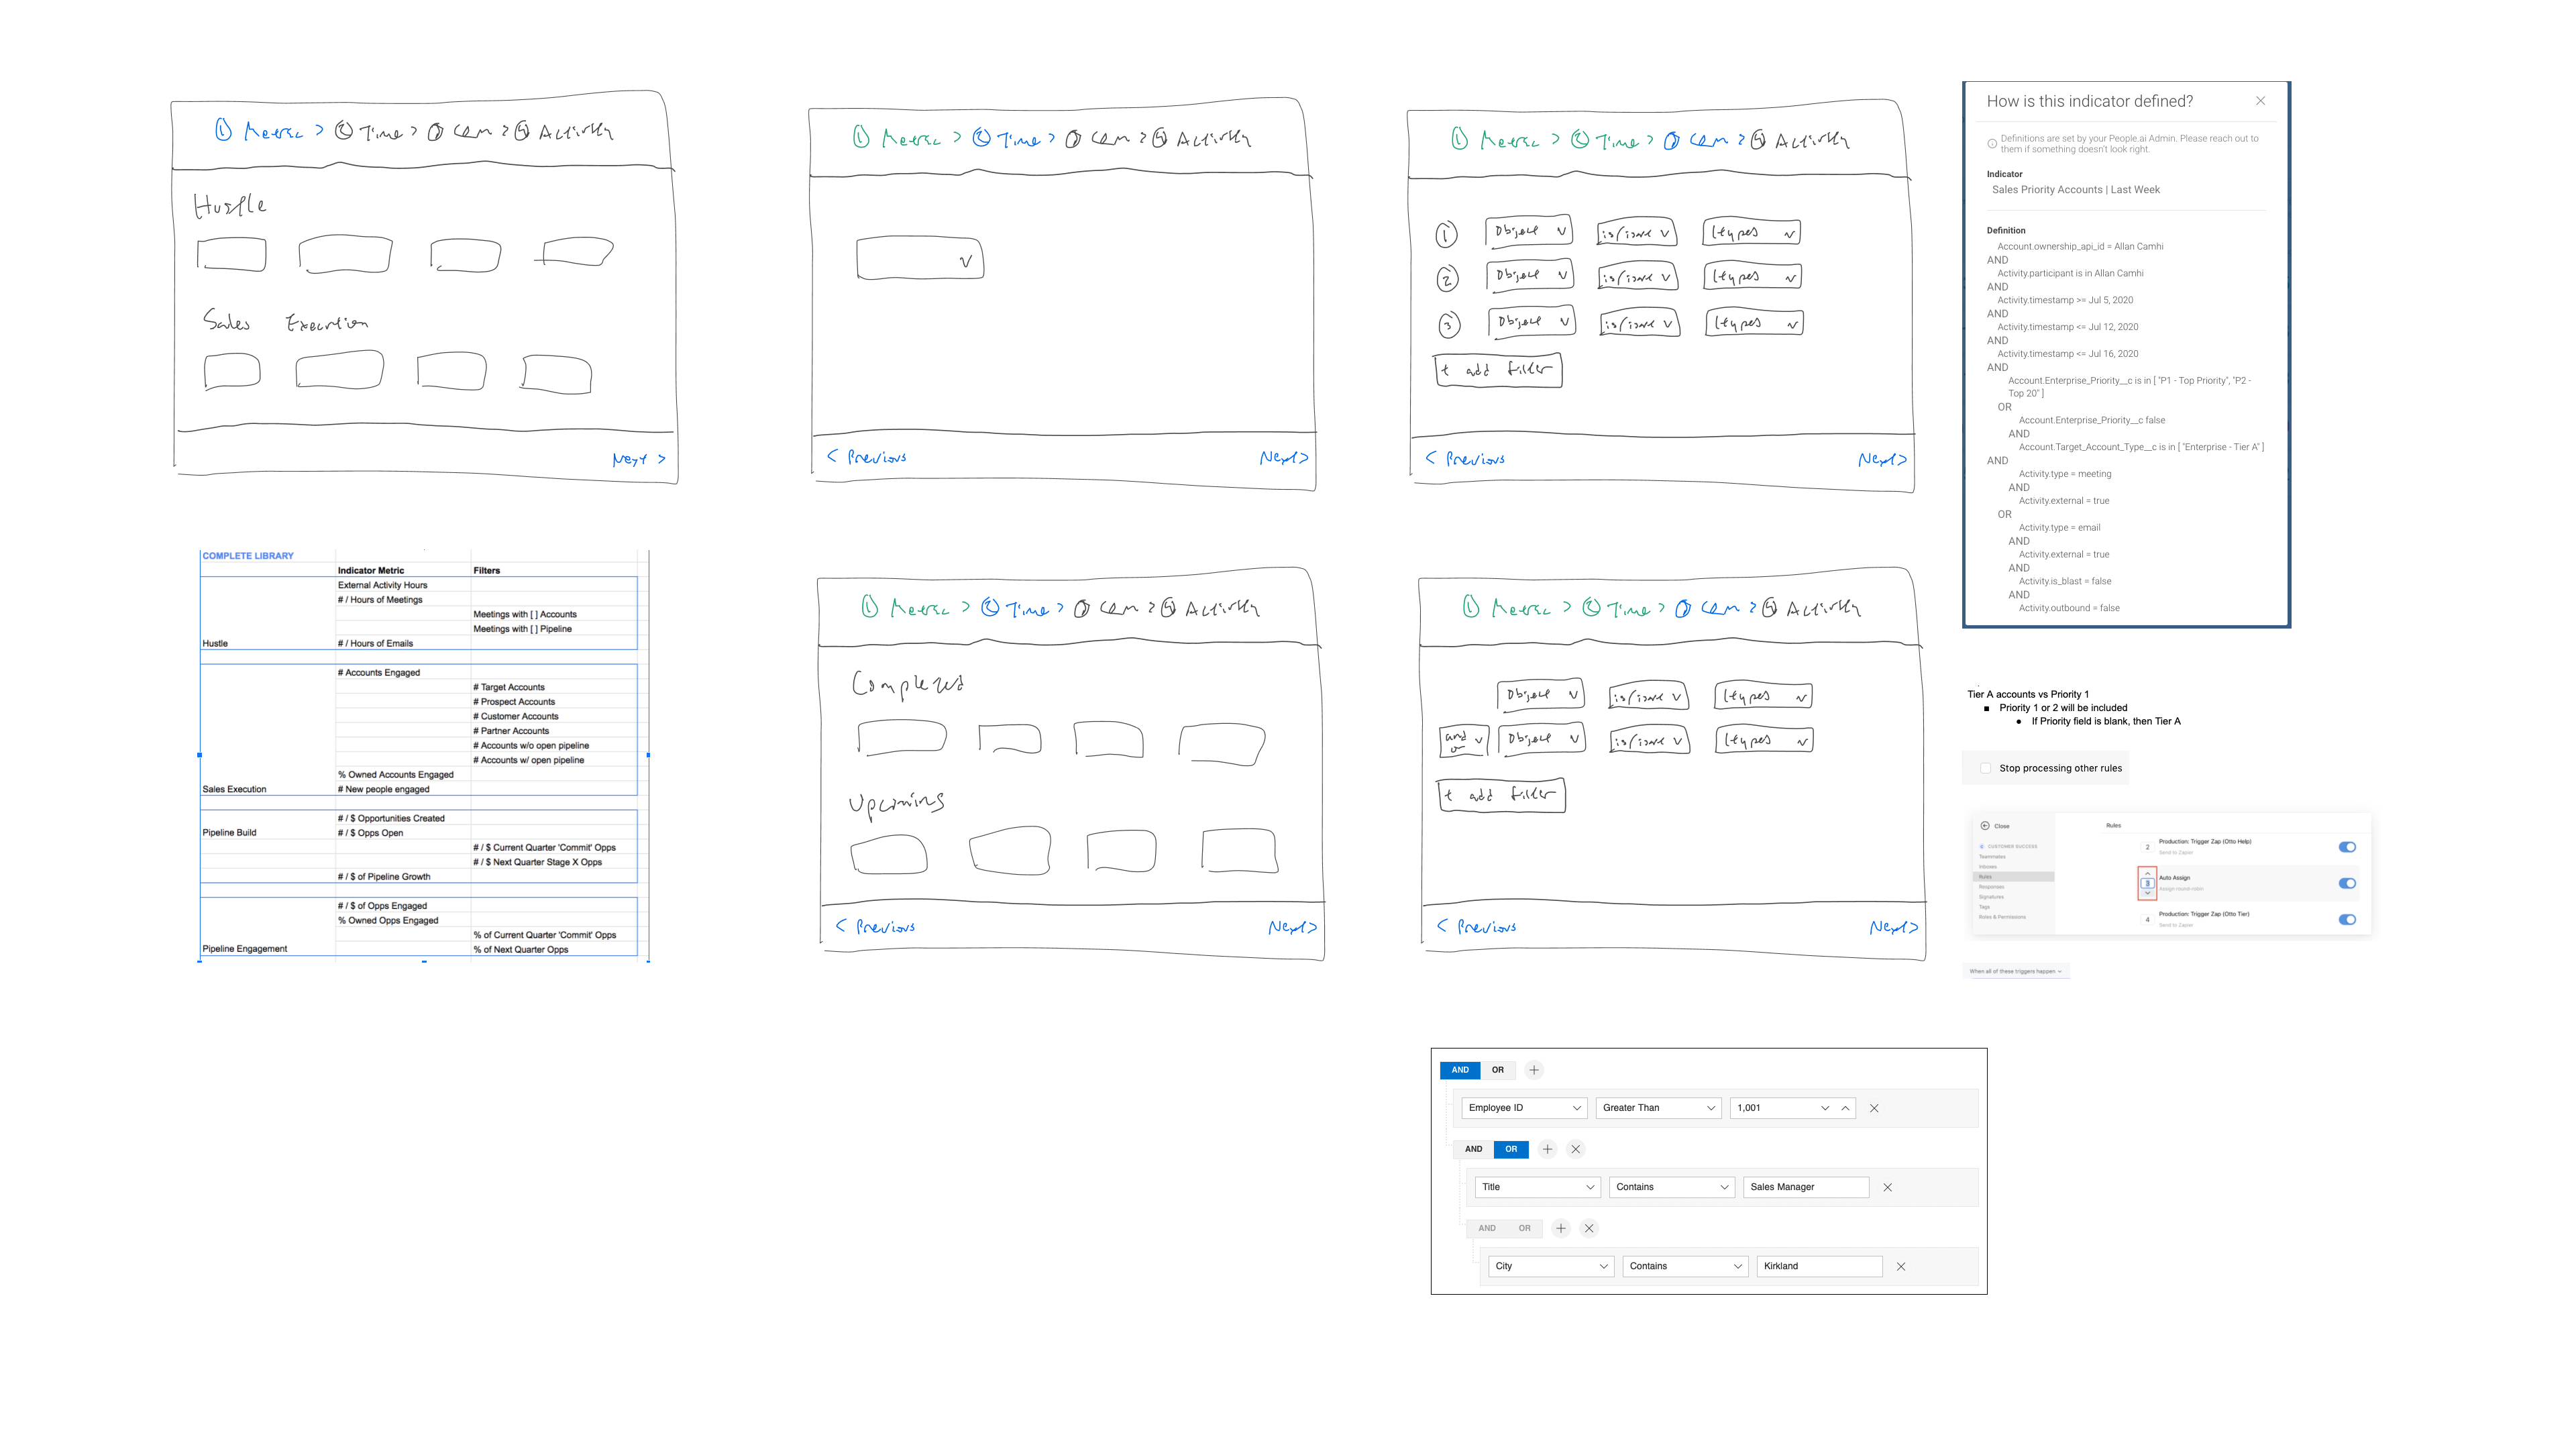
Working with the product manager, I also looked for ways to make the experience more navigable. We explored template libraries similar to the previous recipes concept, and, due to internal feedback, focused more on creating a query builder.
We had additional internal feedback regarding splitting the query part of the leading indicators from creating a set of indicators for the Team Performance view, but engineering limitations meant that we had to create this as a single flow.
The result was a process that took anywhere between 6 and 32 steps per team depending on the number of indicators an admin wanted to configure.
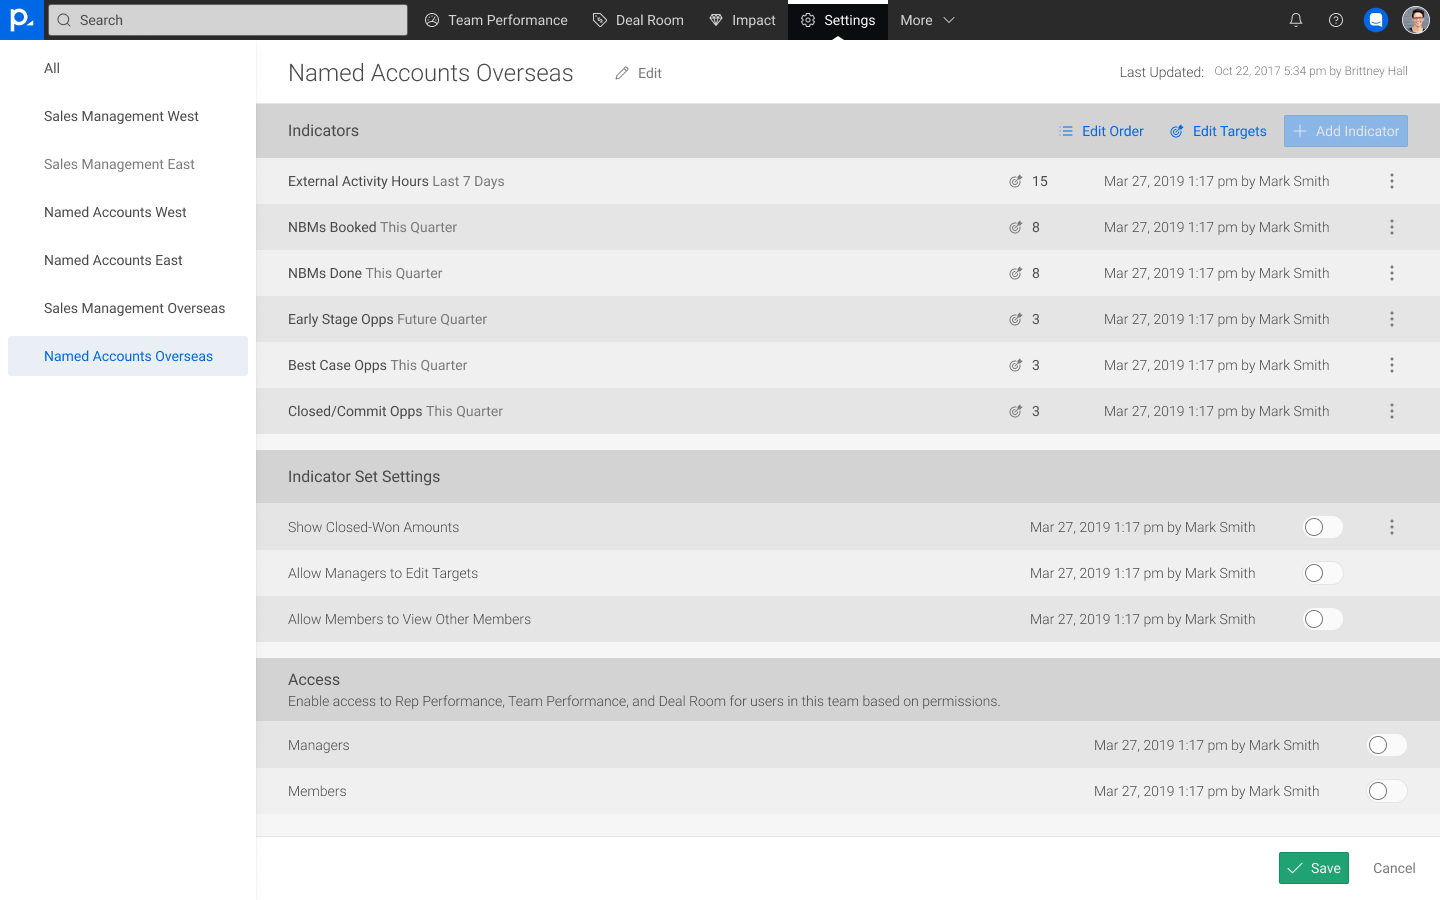
Because the process of creating a set of indicators was ultimately complicated and laborious, largely due to us having to design around an already-implemented system rather than the intended user flow, we lacked the confidence to release this as a self-service feature to our customers.
As we began to work on Engagement Dashboards, we realized that we needed to prioritize the data customization experience.
- Because the leading indicators were not self-service, this meant we were incurring significant overhead when onboarding new customers, as well as when existing customers wanted to make changes.
- The lack of self-service also reduced how much visibility into our system customers felt that they had, which affected how much flexibility they believed that they had with the Sales Solution.
- During the Leading Indicators process, we also failed to provide an adequate out-of-the-box experience for customers that were less familiar with the concept, which contributed to user frustration and internal overhead.
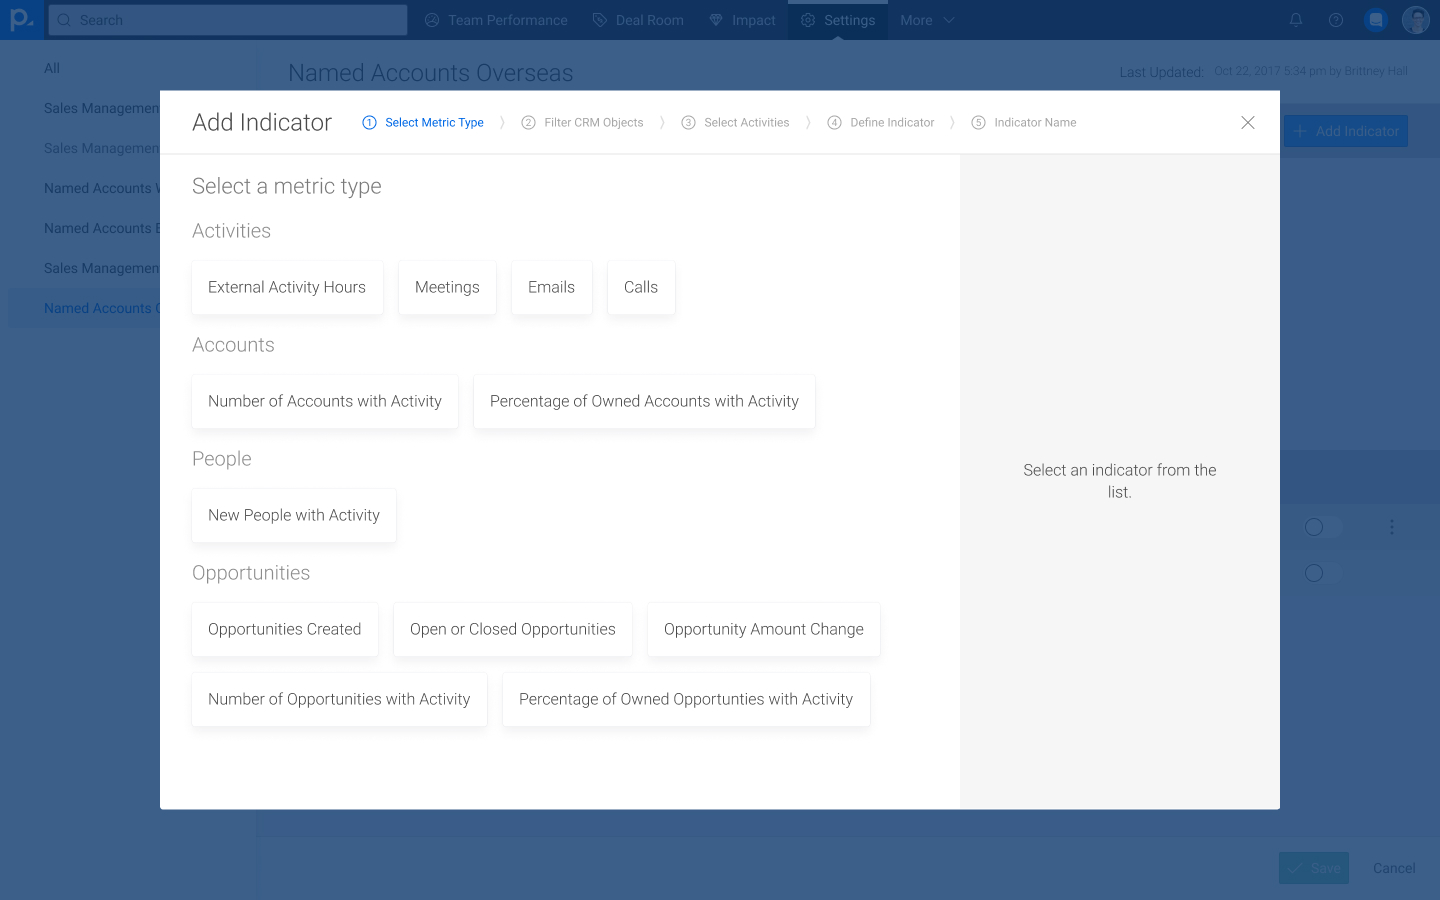
We began to work on the next iteration of our custom metrics efforts, this time dubbed the Insights Builder.
We included the process of creating a metric as part of the overall vision for Engagement Dashboards from the onset to ensure that this was prioritized alongside the consumption side of the project.
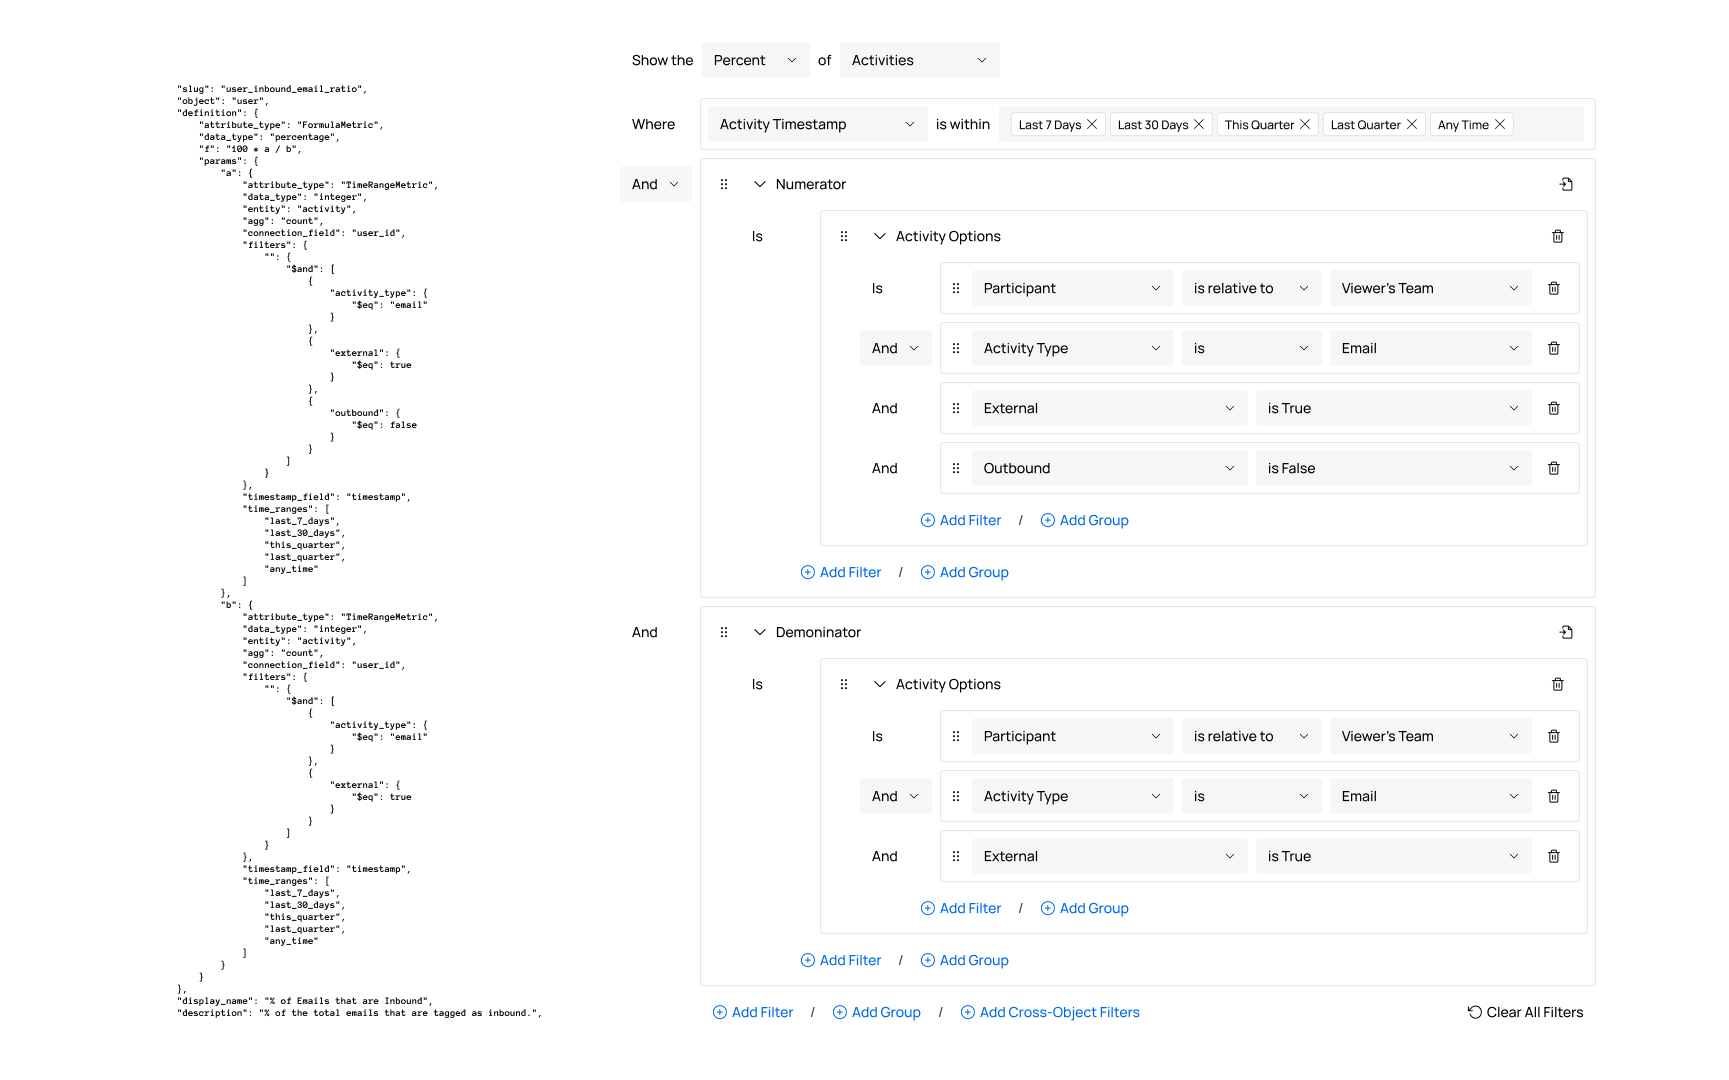
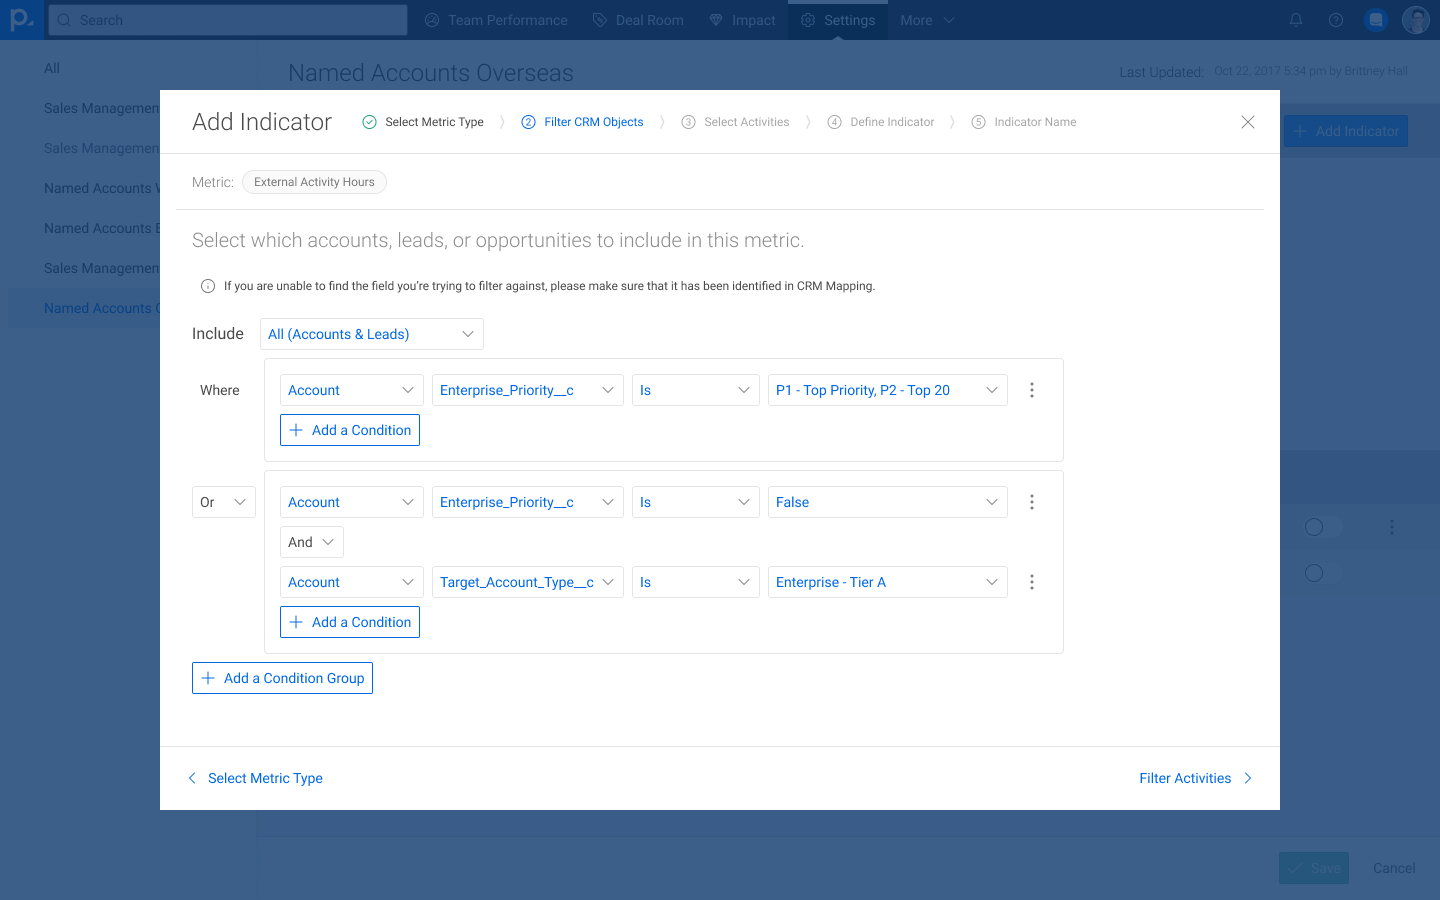
Product and engineering began working building the query engine for which the UI was later created. Unlike with Leading Indicators, the logical structure was given priority over specific customer requests.
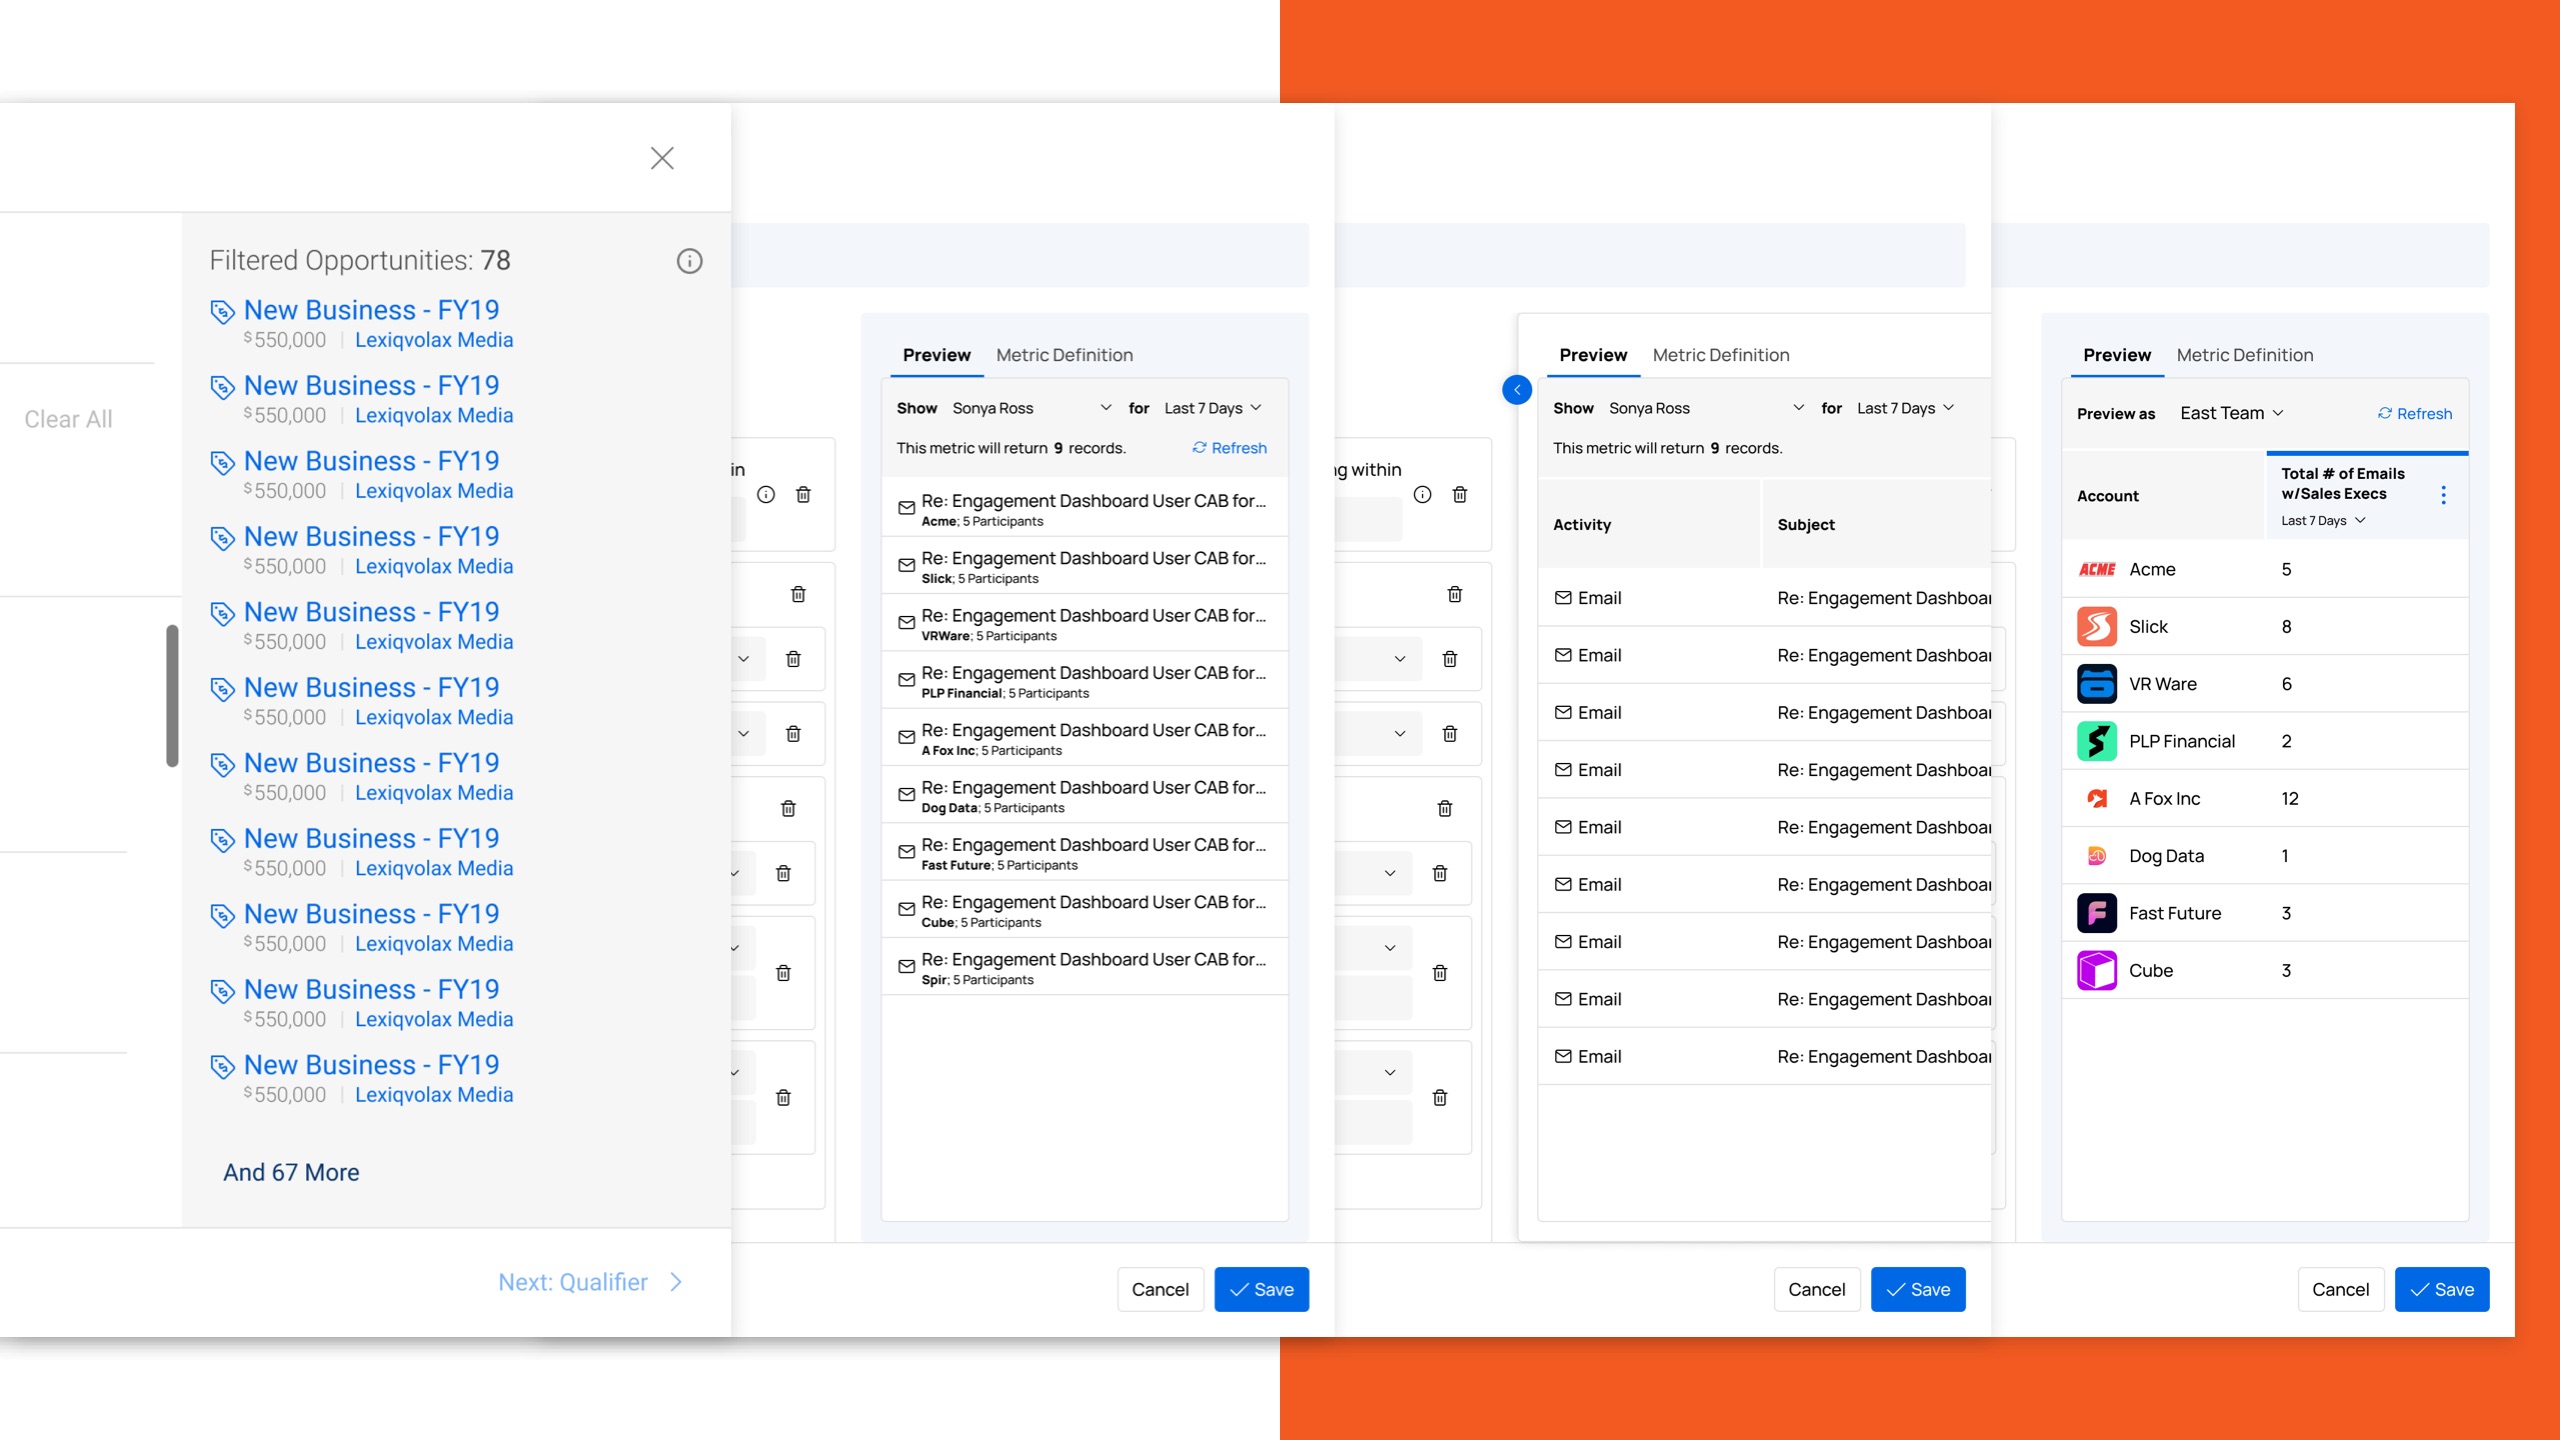
I worked on various iterations for the data preview, each based on feedback from different personas. Different people wanted different levels of data granularity, and we needed to strike a happy medium.
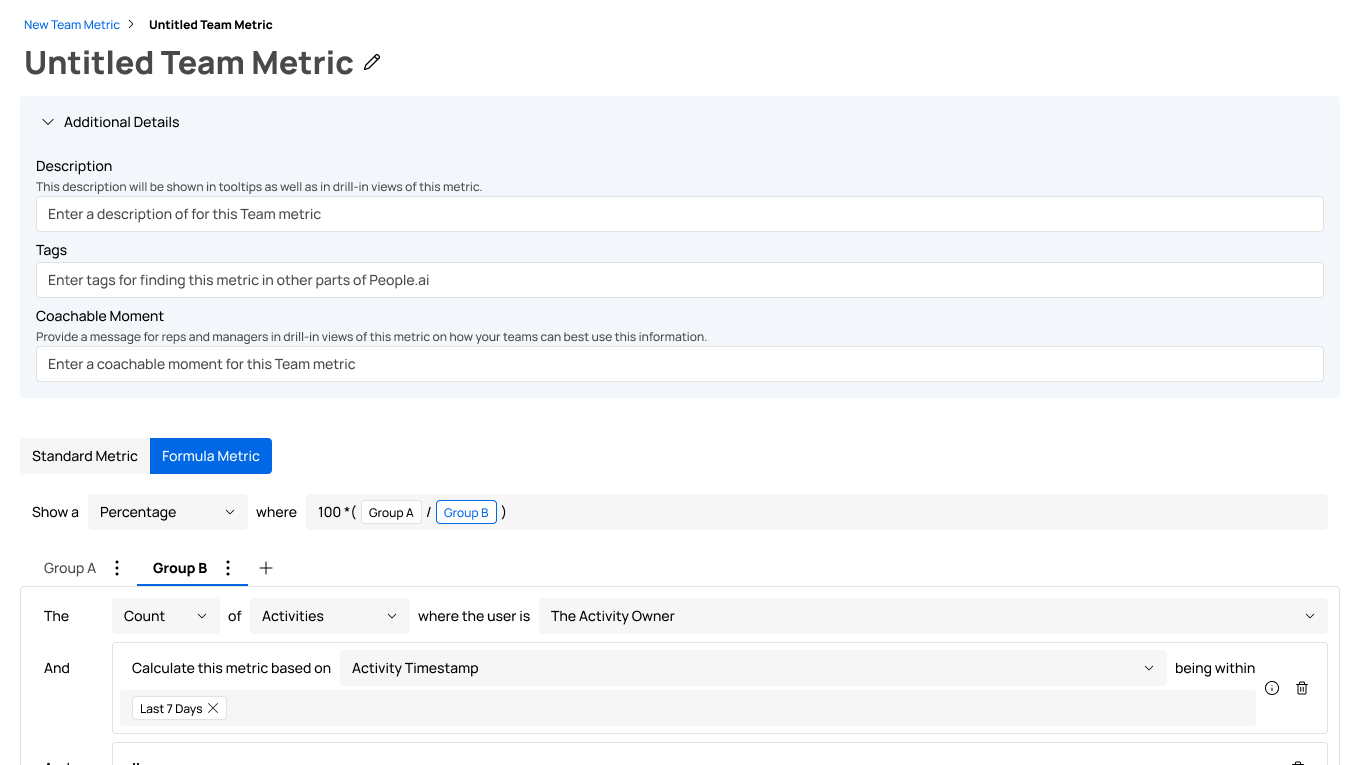
I also worked consolidating the previous five-step flow into a single page by moving the additional details into a collapsible element and putting the additional parameters in context of the query builder itself.
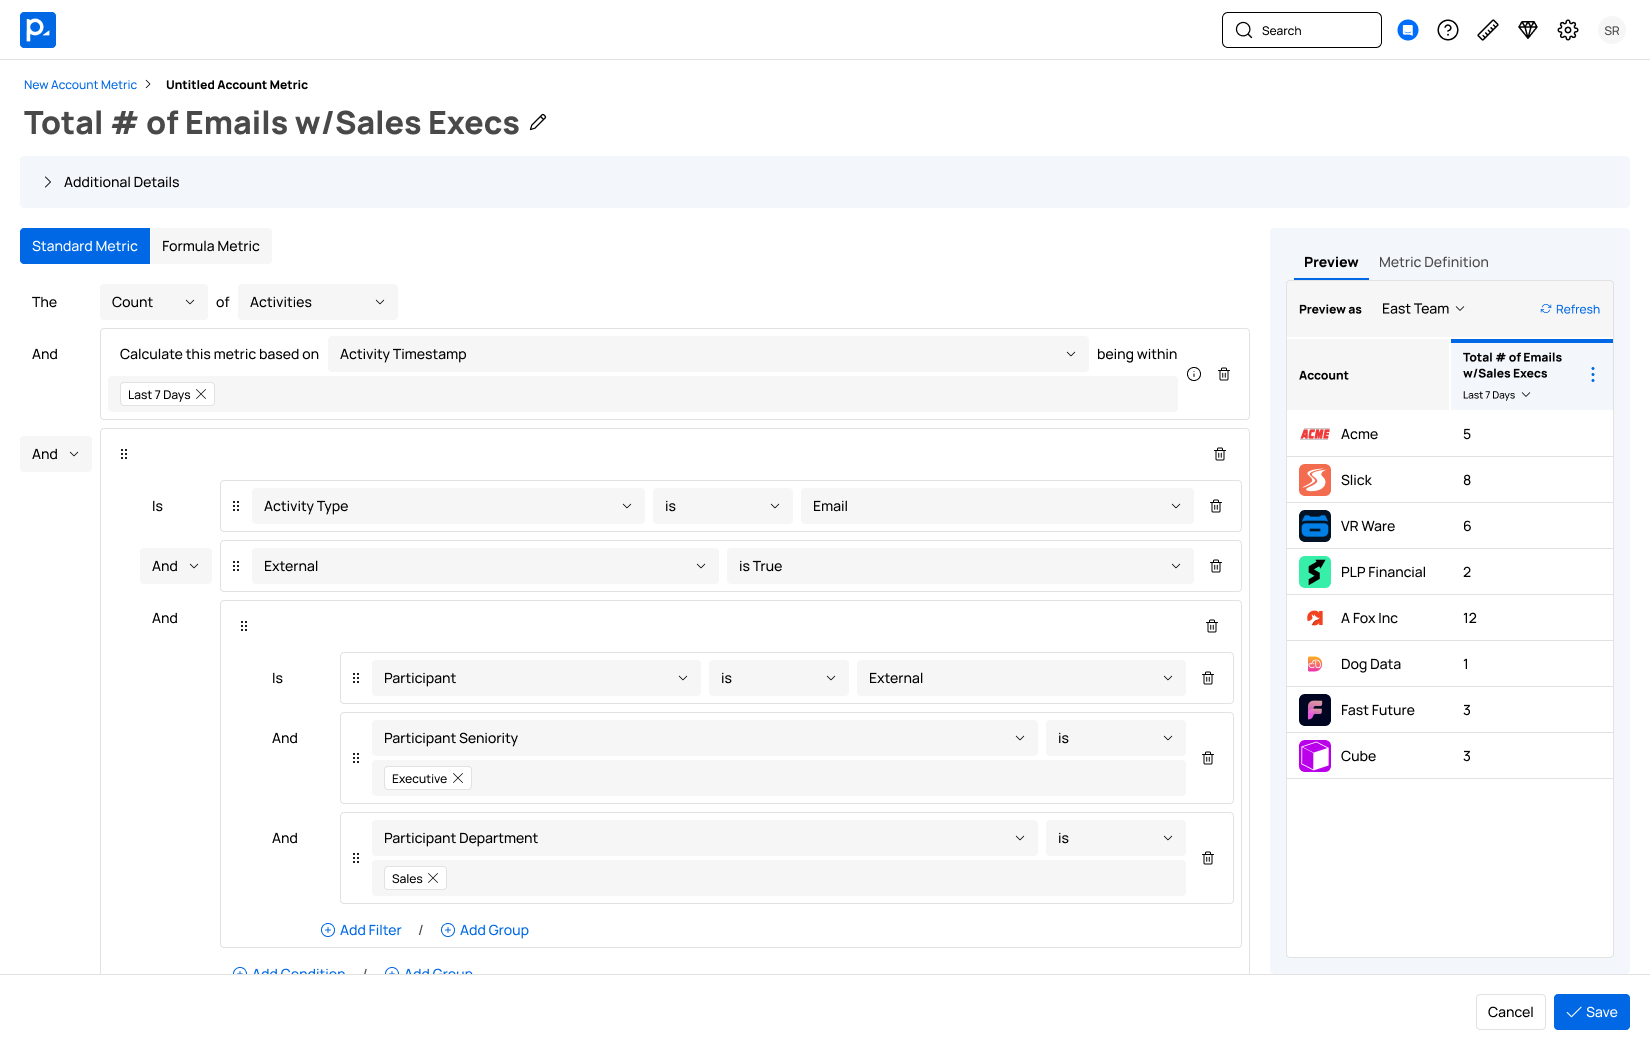
The Insights Builder was designed to provide enough functionality for advanced users while being simple enough for users with less-demanding needs.
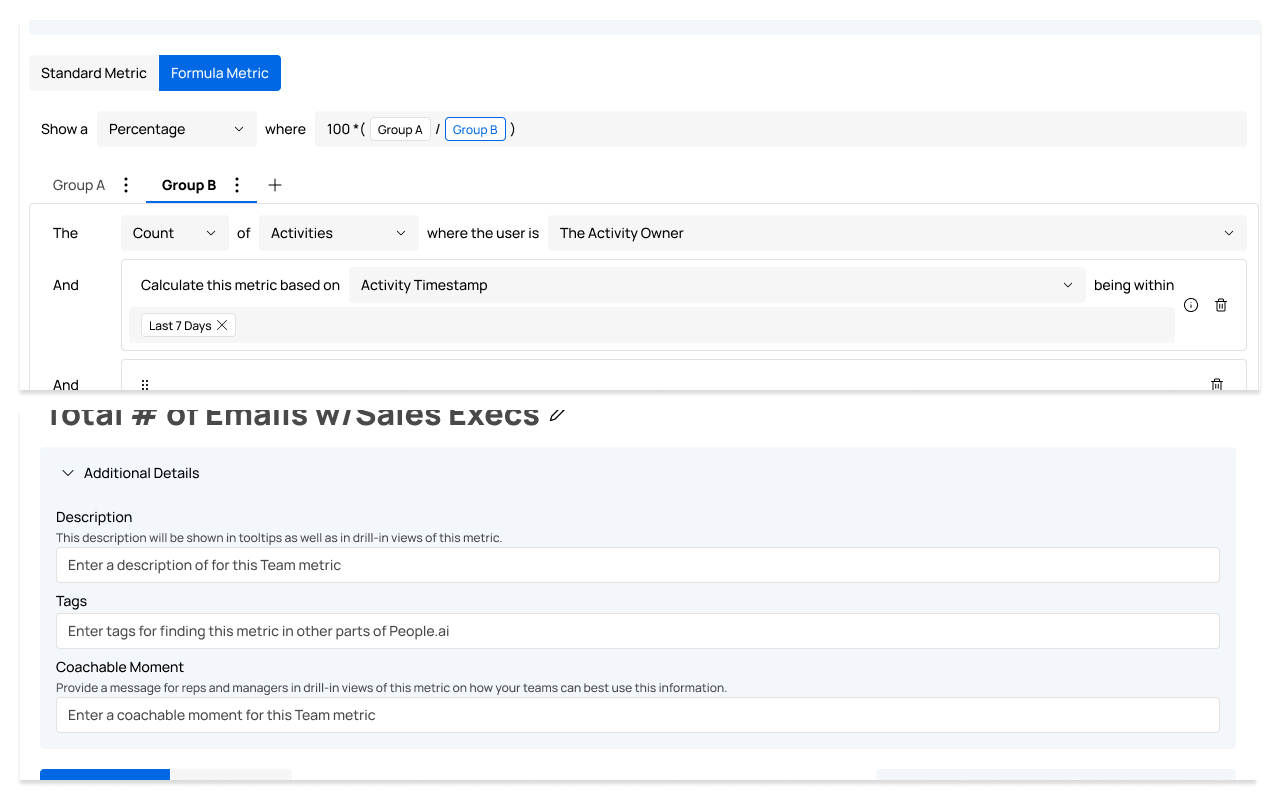
For more advanced users, we wanted to give them the most amount of flexibility, including the ability to create formula metrics and the ability to define "coachable moments" to help their team understand how the metric is intended to be interpreted.
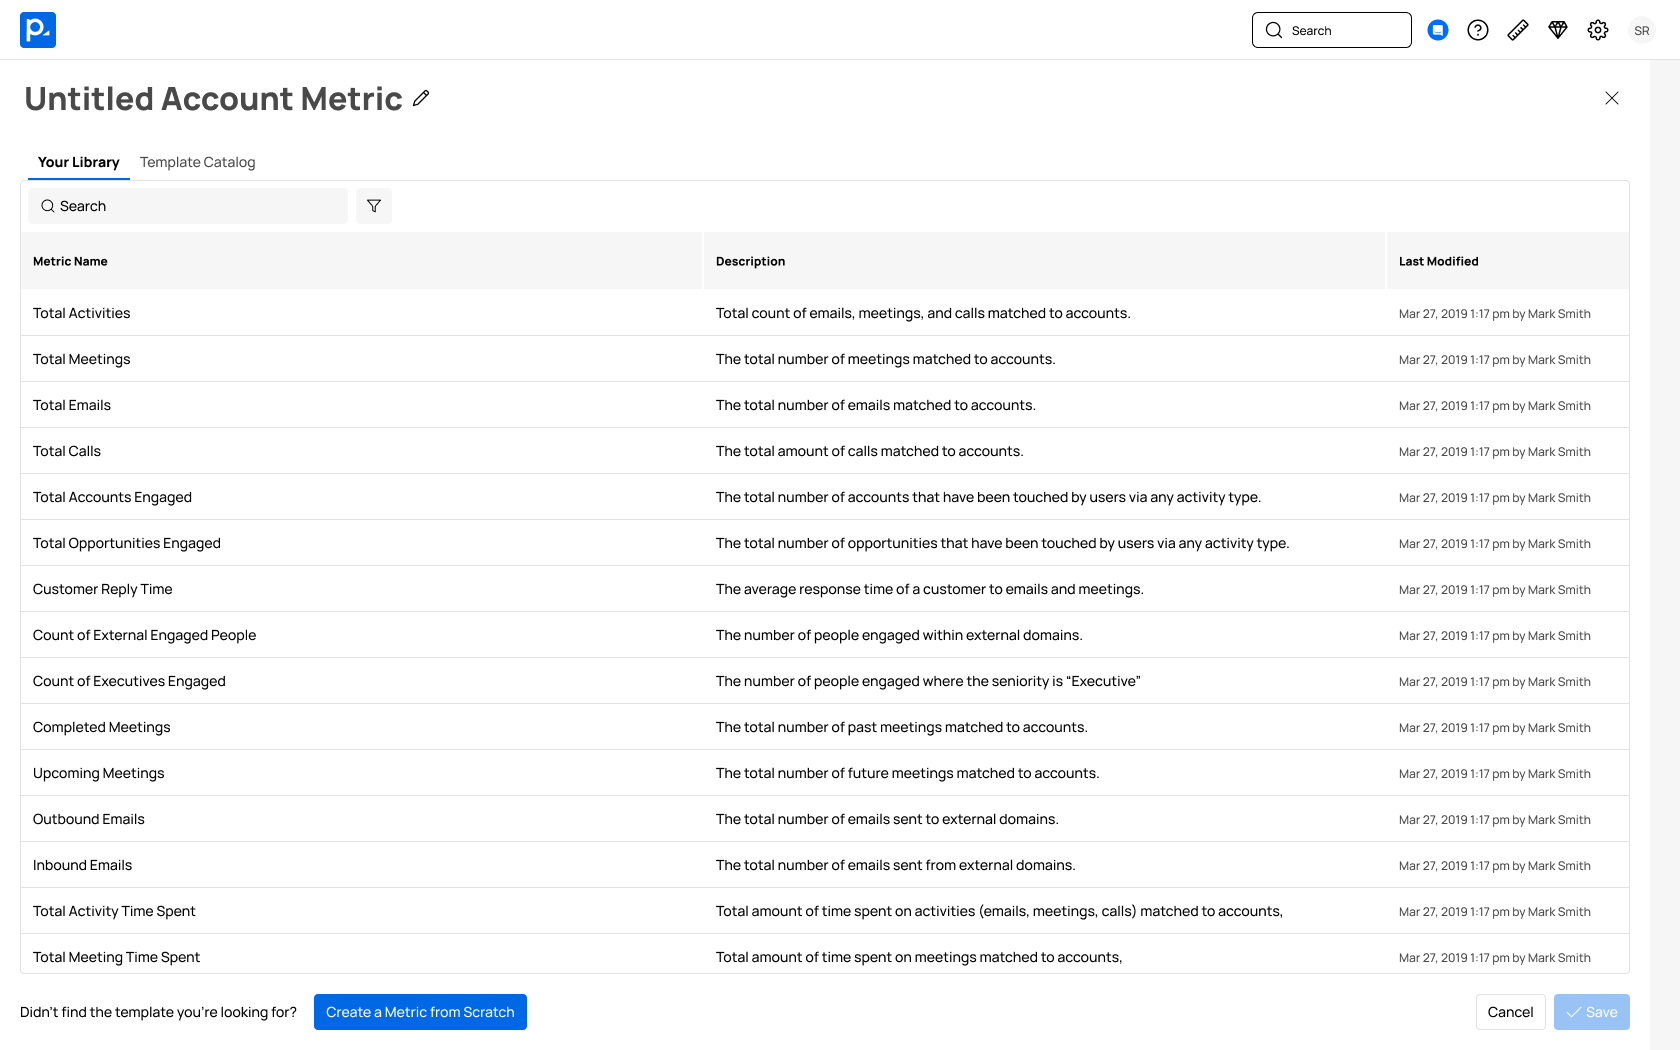
We wanted to keep the metric creation process as simple as possible for all users by encouraging users to copy from an existing metric or a template in the first step of the flow; however, the ability to create from scratch was still available for users that preferred it.